

They laughed at his trade.
But in the end, it was he who was laughing – all the way to the bank.
This is the story of a fictitious options trader who placed a calendar spread on the stock Oracle (ORCL) and allowed it to expire.
Contents
A put calendar spread involves the sale of a put option (the short put) and the purchase of another put option (the long put) with a different expiration date.
In this example, the short put option expires in one week, while the long put option expires in two weeks.
There is a one-week time difference between the expirations.
This is why these trades are under the category of time spreads.
Date: August 22, 2025
Price: ORCL @ $235.82
Sell one Sept August 29 ORCL $235 put @ $4.63
Buy one September 5 ORCL $235 put @ $6.15
Net debit: -$153
For it to be defined as a calendar, the strikes of the short put and the long put are the same, in this case $235.
It is typical for non-directional calendars to have the strikes near the current price of the stock (as in this example).
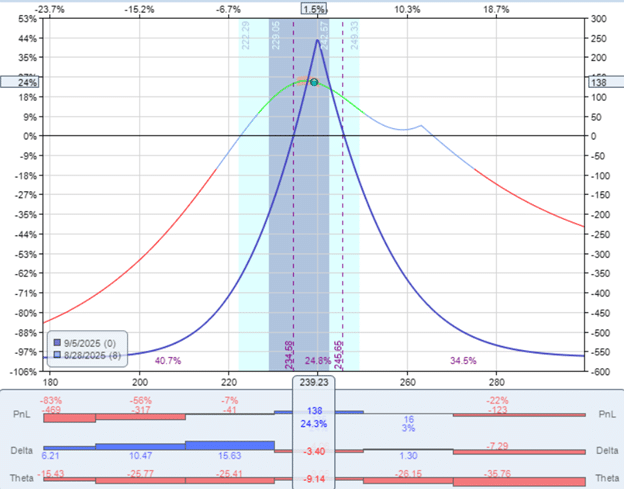
This will result in the following risk graph, which shows the P&L at the expiration of the short option.
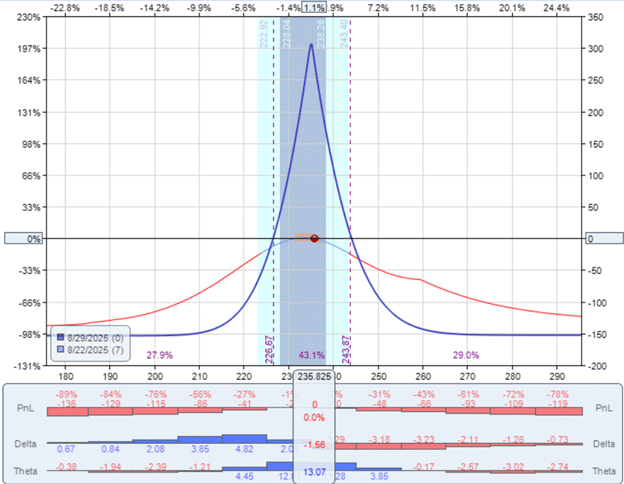
The peak of the expiration graph is centered at the money where the current price of ORCL is.
The max risk in this calendar is the debit paid ($153 in this case).
This calendar has a max potential reward of $300 according to the model.
Hence, it has a reward-to-risk ratio of 2-to-1, which is quite common.
In fact, many calendars have an even higher reward-to-risk ratio, ranging from 3-to-1 to 4-to-1.
As is typical of calendars, the trade has a positive theta, meaning it profits from the passage of time.
This calendar has a theta of 13.
The option trader in our story placed a similar calendar spread on ORCL on the same date.
But he had chosen different expirations for his put options:
Date: August 22, 2025
Price: ORCL @ $235.82
Sell one September 5 ORCL $240 put @ $8.98
Buy one September 12 ORCL $240 put @ $14.6
Net debit: -$565
The trader sold a put option (the short leg) that expires two weeks from the date.
And he bought a put option (the long leg) that expires three weeks from the date.
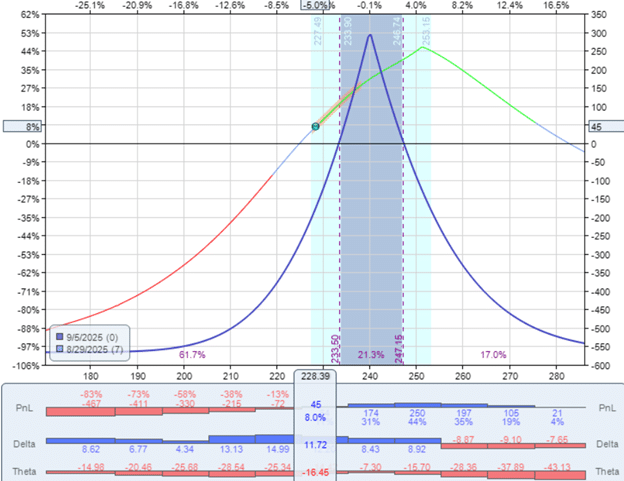
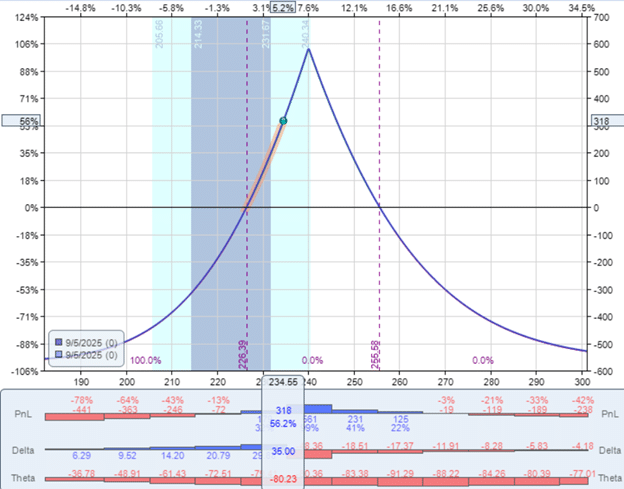
When his trading buddies looked at the expiration graph, they laughed because it seemed very odd:
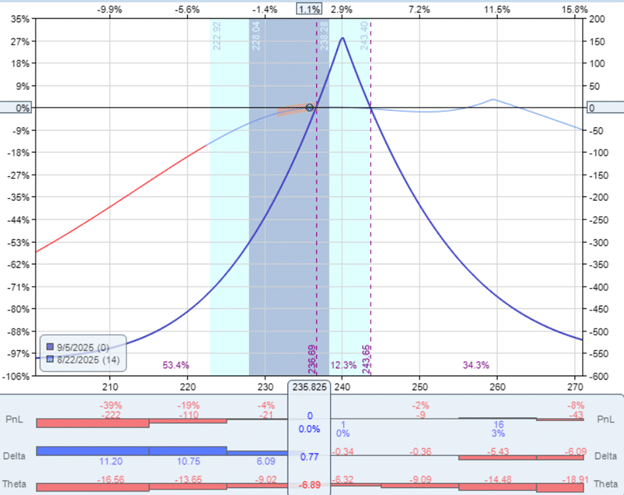
It shows the maximum reward of $150, while the maximum risk is $565.
This represents a very poor reward-to-risk ratio of 0.27.
Even more strange is that our trader’s calendar is showing a negative theta of -6.89 according to the theoretical models of OptionNet Explorer.
This unusual characteristic is due to Oracle reporting earnings after the market closes on September 9.
Therefore, the long option that expires on Friday, immediately following earnings, has an elevated implied volatility (IV) of 55, while the short option that expires before the earnings has a lower IV of 36.
Our trader is selling an option with low implied volatility (IV) and buying an option with high IV.
The price of an option is related to its IV.
Generally, higher IVs result in higher option prices.
The short option that he is selling is low in IV, and hence low in premium received.
It is not able to significantly offset the high price of the long option, which has high IV.
Therefore, he had to pay a lot for the calendar, resulting in a poor reward-to-risk ratio.
In any case, let’s see what happens to this trader’s calendar.
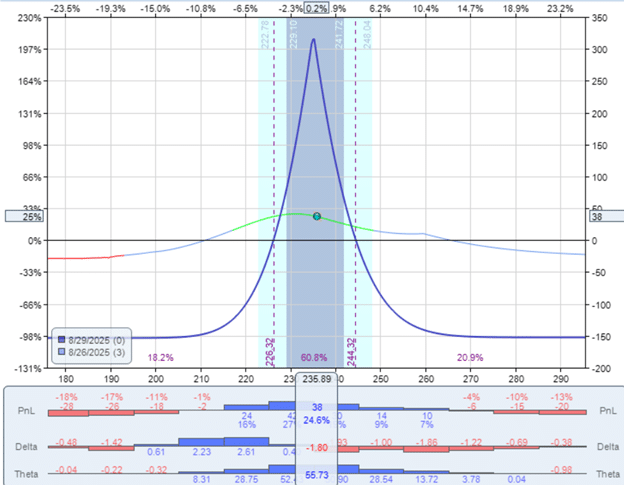
On the next trading day (Monday), the calendar has a profit of $55.
On Tuesday, the calendar has a profit of $77.50, which is nearly 14% return on capital at risk:
$77.50 / $565 = 14%
His trading buddies stopped laughing.
The price of ORCL has remained relatively stable, still at $235.82.
And theta is still showing negative at -8.
Yet, this calendar is somehow making money.
The profit from this calendar is not derived from the ORCL price movement or the theta time effects.
But rather from the IV changes between the short and long legs of the option.
The short leg remains at 36 IV.
But the long leg has increased by 5 points in IV to 60 due to the approaching earnings report.
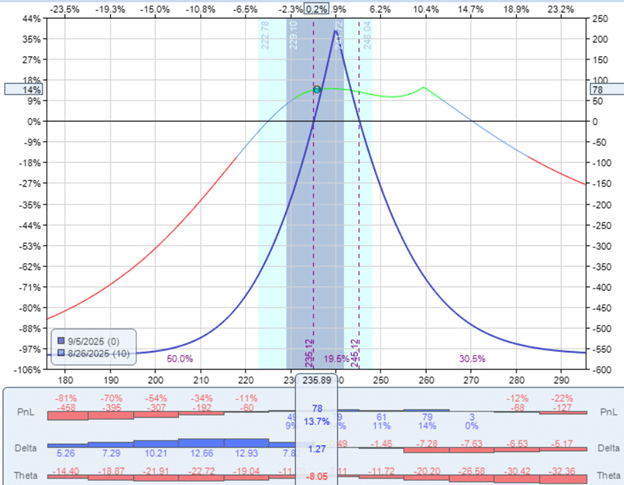
On Thursday, six days into the trade, the trader’s calendar had a profit of $137.50 as the price of ORCL ran up to the strikes of the options…
This profit is due to both price movement and favorable IV changes.
The short option’s IV dropped to 34.
This is favorable because when selling options, you want IV (and hence the option price) to drop.
The long option’s IV increased to 61.
The long option that the trader bought is gaining value.
Now his trading buddies were cheering him on to take the 24% profit.
But the trader said no.
The next day, the price of ORCL dropped, and profits dropped to $45:
His trading buddies said, “I told you so.”
The trader said not to worry.
He still had another week till expiration.
With one more day till expiration, his buddies started worrying for him.
Because the trade is now down -$270:
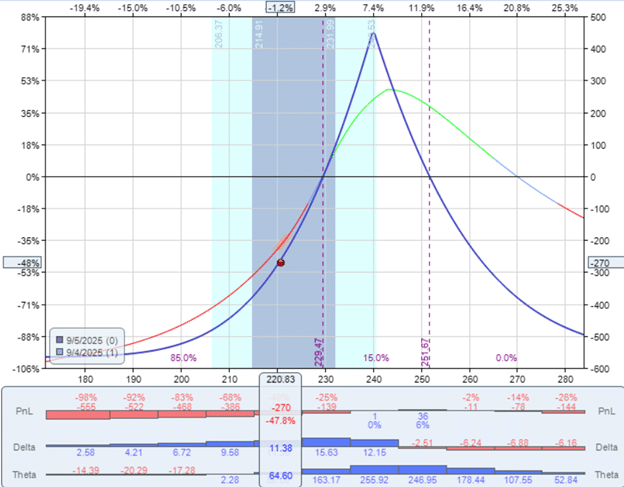
And it can potentially lose the maximum loss of $565.
On the morning session of expiration day, the trade was back to breakeven:
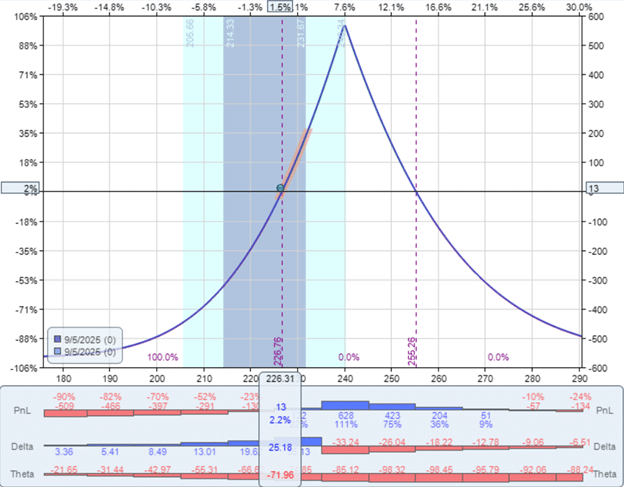
His buddies were yelling for him to get out now.
But he refused.
In the last hour before expiration, the trade showed a profit of $317.50:
The trader said:
“Yeah, I can get out now with a profitable 56% return. But I won’t.”
His trading buddies stared at him in disbelief.
ORCL closed at $232.80 at expiration.
Since the short put option has a $240 240-strike that is above the ORCL price, the option trader was assigned 100 shares of ORCL, paying $240 per share.
On Monday morning, September 8, the trader noticed that his account now held 100 shares of ORCL and $24,000 had been debited from the account.
In fact, if the trader wanted to sell those 100 shares and also sell the long put option, he could have ended the trade with a net profit of $452.
Initial purchase of calendar: -$565
Assigned 100 shares at $240/share: -$24,000
Sell 100 shares at Monday morning price of $237.50: +$23,750
Sell the Sept 12th ORCL $240 put option: +$1,267
Net profit in trade: $452
But the trader still didn’t want to close the trade.
He told his trading buddies that he actually wanted those 100 shares because he predicted that ORCL would jump up after its earnings report.
But if his prediction is wrong and ORCL tanks, he still has the long put option as insurance.
The trade will continue, with a maximum risk of $565 as before, provided that he still holds his long put option.
Even if ORCL goes to zero, he can sell back his 100 shares at $240 per share, the same price at which he was forced to buy them during the assignment.
The worst that he can lose is the price he initially paid for the calendar, which is $565.
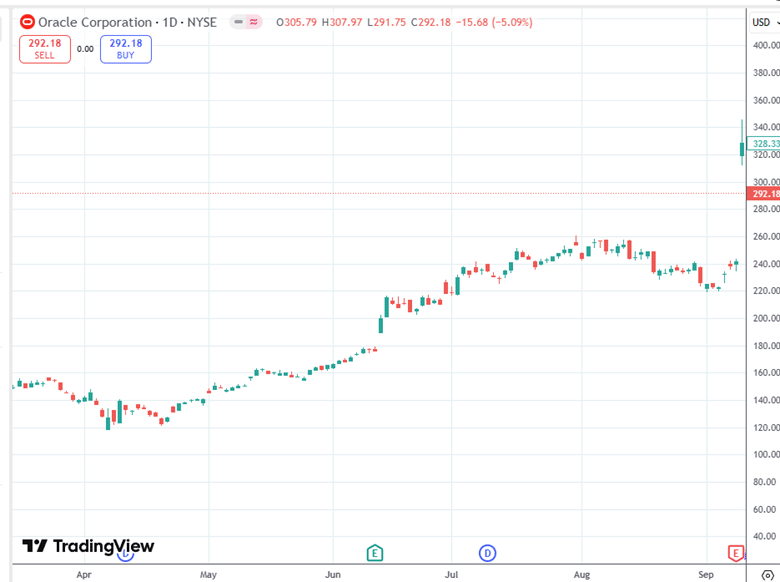
On the morning of September 10, after the earnings report, ORCL gapped up and opened at $319.19.
The stock reached $340 a share at some point.
In this story, the trader was able to sell his 100 shares at $330 per share.
The net gain in the entire trade is $ 8,435.
Initial purchase of calendar: -$565
Assigned 100 shares at $240/share: -$24,000
Sold 100 shares at $330/share: 33,000
Net profit in trade: $8,435
He didn’t even bother to sell the long put option, which still has two days till expiration.
Because ORCL had gone so far above the put strike, the option is worth only $1.50 per contract.
The story highlights the fact that calendars could behave in odd ways.
Examining the risk graphs above, we observe that the shape can change significantly throughout the trade, thereby altering the reward-to-risk ratio.
Some beginning traders might find calendars quite unpredictable.
But once you understand that time spreads are sensitive to the relative IV changes of the two legs, then the behavior becomes more understandable.
The options trader in our story is not unlearned in options.
He understood exactly what he was doing.
Perhaps the calendar was not the trade he was interested in.
He was more interested in the earnings play.
He sold a cash-secured put with an expiration date of September 5, which is before the earnings date, to obtain 100 shares of stock.
He also wanted a long put option that expires after the earnings – to protect his stock investment in case the earnings move goes badly.
This limited his loss in this case to $565.
With a bit of luck, he reaped a reward of $8435, which is 15 times more than his risk.
There was some luck involved, because it is not often that a stock can jump up 35% in one day (even with earnings reporting).
Since a capital of $24,000 was needed for the purchase of the stock, he made a 35% return on this capital.
$8,435 / $24,000 = 35%
His trading buddies are in awe.
We hope you enjoyed this article on this calendar spread at expiration.
If you have any questions, send an email or leave a comment below.
Trade safe!
Disclaimer: The information above is for educational purposes only and should not be treated as investment advice. The strategy presented would not be suitable for investors who are not familiar with exchange traded options. Any readers interested in this strategy should do their own research and seek advice from a licensed financial adviser.

Saved! I know I’ll be coming back to this.
I don’t even know how I ended up here, but I thought this post was good. I don’t know who you are but definitely you’re going to a famous blogger if you aren’t already 😉 Cheers!
You got a very fantastic website, Gladiolus I discovered it through yahoo.
There is apparently a bunch to realize about this. I suppose you made various good points in features also.