
Yet another book on yet another technical chart indicator.
This was what I thought too – until I read the first sentence of the preface, where the author said that an accident broke his back in two places.
OMG!
Contents
Like the start of a suspense novel, I now had to see what happened.
The name of the book is ADXcellence, Power Trend Strategies.
While the author was in a body cast for six months, there was nothing for him to do other than to learn trading.
The first line of the introduction starts with the sentence:
“How you think is how you trade. To change how you trade, you must first change how you think.”
Hmmm, sounds profound. Who wrote this?
Since I didn’t see any attribution to that quote, I can only assume that it was the author.
The author’s name is Dr. Charles Schaap.
The ‘Dr.’ prefixing his name does refer to him as a medical doctor.
The story ends well when he mentions that he went to Italy with his wife to celebrate the removal of his body cast.
His wife’s name is Candy and is also his trading partner.
The two were trading at Internet cafes during the trip and made enough money to cover the costs of the trip and then some.
He learned two things on that trip:
- Trading is stressful, and the pursuit of happiness should not be interrupted by constant trading.
- The trades that generated the most money were those entered on a strong trend and then left alone.
Some traders gave up on indicators after finding little success with them.
This is because they watched a five-minute YouTube video providing generic buy/sell signals, such as “buy a pullback when ADX is above 25″ or “sell when the -DMI line crosses above the +DMI line.”
But this is too simplistic and is not the way to use indicators.
This nearly 300-page book provides the nuances and context that traders need to understand to use the ADX/DMI indicator effectively.
Others claim that price action is all one needs because all indicators are based on price.
However, there is some information in the indicators that can not be seen in the candlesticks.
Charles Schaap sums it up best by saying:
Understanding price behavior is probably the most important skill a trader can develop. If a trader does not understand basic price and trend principles, no indicator will help them trade effectively.
The book explains these principles and teaches traders to view the indicator in the context of price.
The ADX/DMI provides additional information, including trend strength, direction, and volatility.
ADX stands for Average Directional Index.
It measures the strength of a trend, regardless of whether that trend is up or down.
Looking at SPY on Stockcharts, the black line in the indicator panel is the ADX…
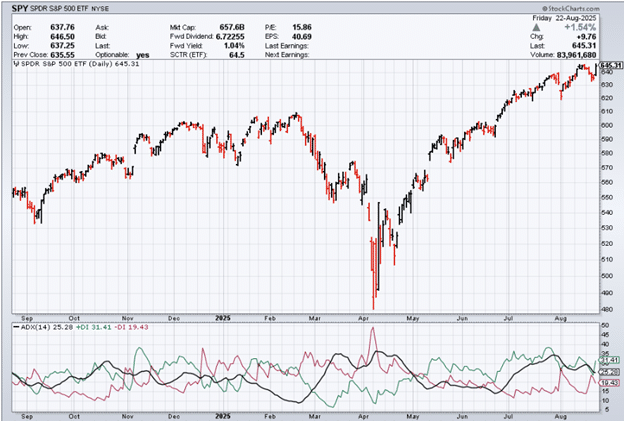
Source: stockcharts.com
We observe that starting in July 2025, the SPY exhibits trend strength, as evidenced by the ADX black line surpassing 25.
The ADX line does not indicate whether this trend is up or down. It simply indicates that it is a strong trend.
To know that you can read the price action of the candles, or read the +DMI (green line) and the -DMI (red line).
The green line is known as the +DMI, or the positive directional movement index. It measures the strength of the buyers.
The red DMI measures the strength of the sellers.
We see that starting in May, the green line crossed above the red line, indicating that the buyers took control.
This is a bullish DMI crossover.
The bearish DMI crossover is when the red line crosses above the green line.
In our chart example, the green line continues to be above the red line as the ADX line increases above 25 in July.
Therefore, we have a strong uptrend starting in July.
Typically, ADX settings on many charting platforms use a 14-period rolling average.
However, Charles Schaap prefers to customize his indicator, using an 8-period ADX and 13-period DI lines.
A community member in TradingView created a custom indicator called ADXcellance that uses Schaap settings.
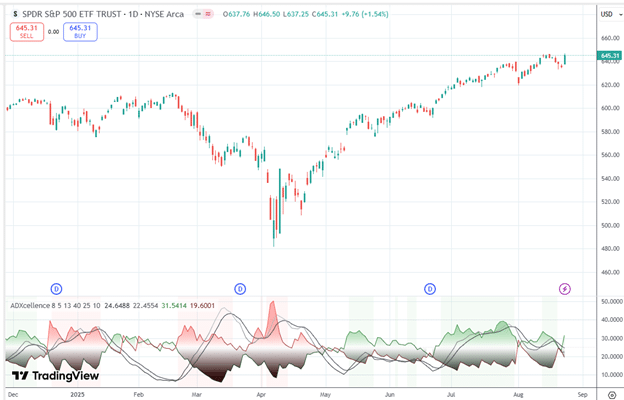
Source: TradingView
I don’t see too much difference between the two chart settings.
Except for the latter, the customized indicator with color shading does a better job of showing the 25 strength level.
The goal of the book is to teach the reader how to use the indicator in conjunction with price action to make decisions such as:
- When a new trend breaks out
- When a trend is strong enough to buy a pullback
- When a trend is getting weak
- When a trend is reversing
- And when the price is consolidating
The author provides numerous examples of this in the book.
He also explains the divergences between price and the DMI line.
For example, when price action is rising, but the DMI is falling.
This is a bearish divergence that can lead to either a price retracement or a price reversal.
Throughout the chapters, boxed key points highlight important concepts to remember.
For example, here is one of them that he writes:
ADX Trend Strength Rule:
When the ADX is above 25, trend strength is strong enough to support trend trading strategies; when the ADX is below 25, it is advisable to avoid trend trading strategies.
ADXcellence is an excellent book.
Sorry, I couldn’t resist the pun – just like Charles Schaap couldn’t resist giving chapter titles like DMI Xplained, ADXplained, ADXodus, ADXtra, ADXplosive, ADXquiste, etc.
We hope you enjoyed this book review article on Adxcellence Power Trend Strategies.
If you have any questions, send an email or leave a comment below.
Trade safe!
Disclaimer: The information above is for educational purposes only and should not be treated as investment advice. The strategy presented would not be suitable for investors who are not familiar with exchange traded options. Any readers interested in this strategy should do their own research and seek advice from a licensed financial adviser.

**mindvault**
mindvault is a premium cognitive support formula created for adults 45+. It’s thoughtfully designed to help maintain clear thinking