
SCTR stands for StockCharts Technical Rank and is pronounced: “scooter.”
It uses a proprietary technique to rank stocks based on technical analysis.
So, you will not find this score outside of StockCharts.com.
Fortunately, StockCharts made it publicly available and not behind a paywall.
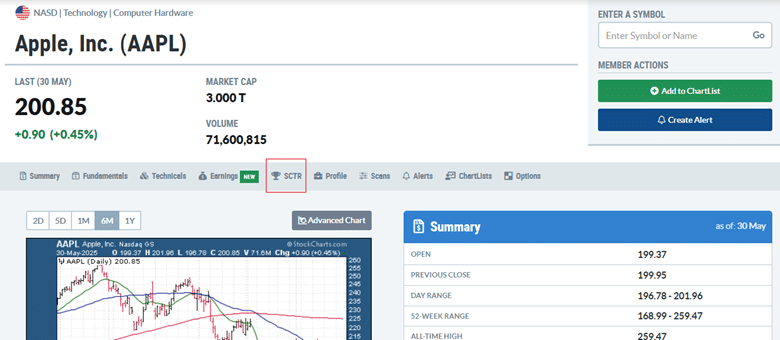
To see the SCTR for your favorite stock, just go to the Symbol Summary page and click on SCTR:
Contents
In the below example, we see that Microsoft’s SCTR of 78 is pretty good (in the green zone).
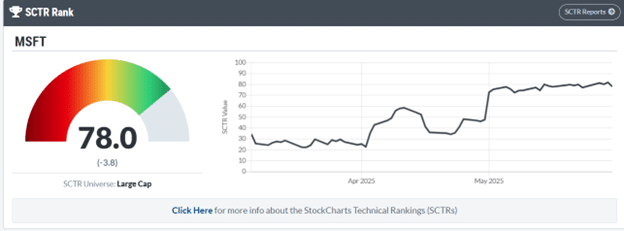
You can even see that this rank has been trending up in the last three months.
A score of 78 can be interpreted as a stock that is outperforming 78% of the stocks in its peer group from a technical perspective.
If you click on the “SCTR report” button on the upper-right, you will find stocks and ETFs sorted by their SCTR score within their peer groups:
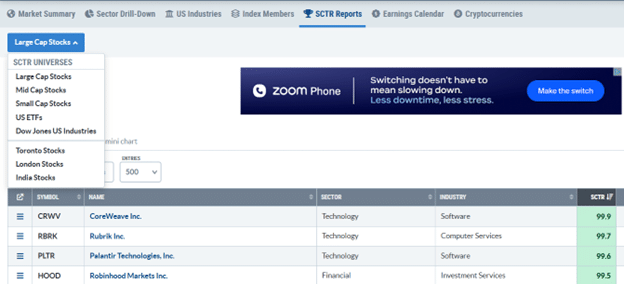
The peer groups are:
Large-cap stocks,
Mid-cap stocks,
Small-cap stocks,
ETFs,
and others
In the dropdown menu, you can select the SCTR universe to see the reports of each peer group.
The score ranges from 0 to 100 and is color-coded for easy interpretation.
Any score of 60 or above means good technical strength and gets a shade of green.
It is even better if the score is 80 or above, which gets a deeper shade of green.
Yellow is neutral.
As you hover over the symbol in the report, you get a quick thumbnail view of the chart.
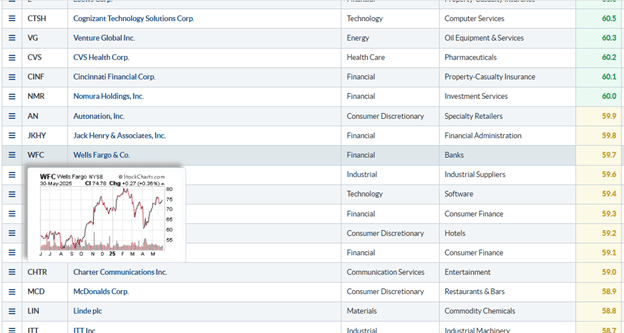
Scores below 40 would be bearish, indicated by a shade of pink.
Scores below 20 get the red color, indicating very weak technicals relative to its peers.
If you were looking for bearish stocks to short, you could reverse-sort the list by clicking the column heading.
Stockcharts has integrated the SCTR score into many areas of its platform.
For example, on the Sector Drill-Down page, we see the SCTR scores of the eleven S&P 500 sector ETFs.
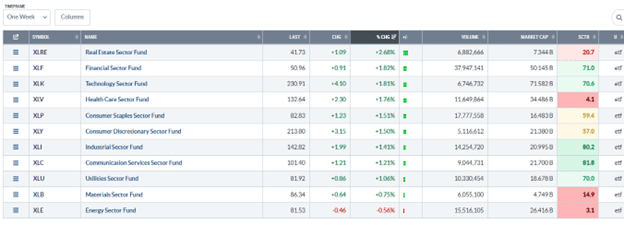
It is essential to recognize that the SCTR score does not directly correlate with performance.
Above, we see that Real Estate is the best performer for the week, with a price per share increase of 2.68%.
Yet, its SCTR is red at 20.7.
When we switch the look-back timeframe to one month in the dropdown:
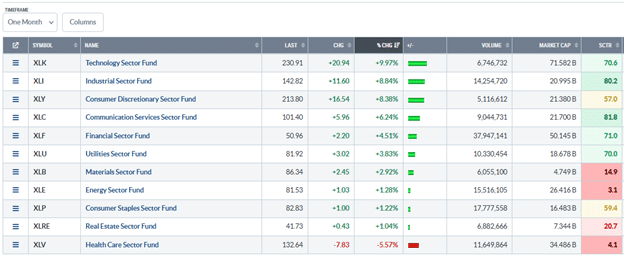
We see that real estate has been lagging behind most sectors over the past month.
It achieved a 1% price gain for the month, while Technology experienced a 10% price gain during the same period.
While the price percentage performance changes as we change timeframes, the SCTR remains unchanged as we change timeframes in the dropdown.
This is because its look-back period remains fixed.
This becomes clearer when we see how the SCTR is calculated and how it gives more weight to the longer perspective.
The SCTR score is based on the following six technical indicators:
- Percent above/below 200-day EMA (30%)
- 125-Day Rate-of-Change (30%)
- Percent above/below 50-day EMA (15%)
- 20-day Rate-of-Change (15%)
- 3-day slope of PPO (5%)
- 14-day RSI (5%)
The first two indicators, involving the 200-day moving average and the 125-day rate of change, are long-term indicators.
At the same time, the 50-EMA and 20-day ROC are considered medium-term indicators.
The 3-day PPO slope and RSI are shorter-term momentum indicators.
In parenthesis is the percentage weight of each indicator’s contribution to the stock’s overall technical score.
You will note that the longer-term technicals are given greater weight.
The overall technical scores for each stock are then sorted within the stock’s peer group and normalized to a range of 0 to 100, resulting in the SCTR score.
VXX and leveraged and inverse ETFs are excluded from SCTR rankings because the high volatility and inverse movements of these products skew the results.
An investor who is looking for a good stock in Real Estate, for example, could click on the “Real Estate Sector Fund” in the Sector Drill-down page and get sub-sectors in Real Estate…

In this case, “Diversified REITs” stands out because it is the only one with a green SCTR score.
A click and a sort will give the investor a bunch of trade ideas in the diversified REITs: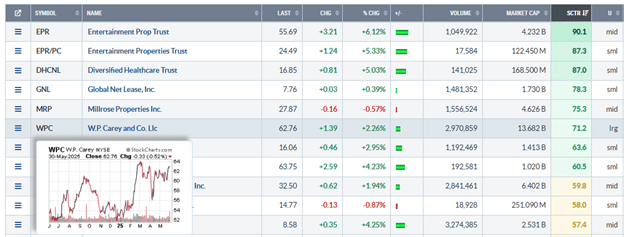
It appears that this investor was seeking large-cap REITs, as evidenced by his focus on WPC, which had a $13.6B market cap in the “lrg” (large cap) peer group.
The SCTR is a straightforward method for investors to identify high-quality stocks based on technical analysis.
We hope you enjoyed this article on understanding the SCTR rank for evaluating a stock’s strength.
Trade safe!
Disclaimer: The information above is for educational purposes only and should not be treated as investment advice. The strategy presented would not be suitable for investors who are not familiar with exchange traded options. Any readers interested in this strategy should do their own research and seek advice from a licensed financial adviser.

