
Let’s first talk about the Nasdaq-100 Index, then about the QQQ, and then finally talk about the TQQQ.
Maybe you already know how the three are related.
But in the end, you will understand how beta slippage can cause unexpected results.
Contents
The Nasdaq-100 Index includes 100 of the largest non-financial companies listed on the Nasdaq stock market.
The Nasdaq is heavy in technology companies.
The top constituents of the index include:
Nvidia (NVDA)
Microsoft (MSFT)
Apple (AAPL)
Amazon (AMZN)
Broadcom (AVGO)
Meta (META)
Netflix (NFLX)
Tesla (TSLA)
Costco (COST)
Alphabet (GOOGL)
Those 10 companies make up half of the index in terms of percentage of representation.
The Nasdaq-100 Index does have a ticker symbol of NDX.
However, you cannot buy shares of it because it is an index.
Investors seeking exposure to the Nasdaq group of companies can purchase the QQQ exchange-traded fund, created by Invesco.
It has the same makeup as the NDX and hence tracks the Nasdaq-100 index.
The QQQ is freely traded in the market, where investors can buy and sell shares as well as options contracts.
Because some of the companies in the QQQ give a dividend, the QQQ shareholders also receive a dividend.
As the below chart shows, one share of QQQ is valued at $530 per share.
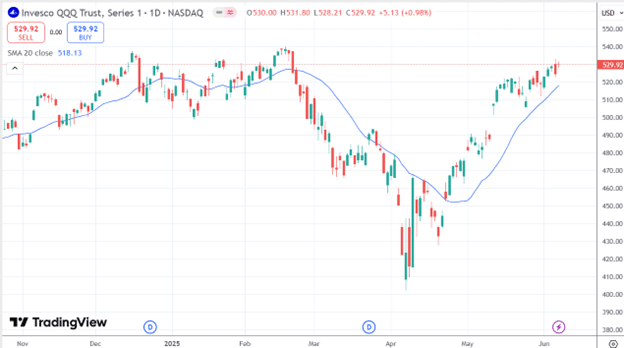
Source: Tradingview
If you compare this chart of QQQ with that of NDX, they will match almost exactly.
Hence, buying QQQ is like buying the Nasdaq index.
Their performance matches one-to-one.
The TQQQ is a different ETF.
Created by ProShares, it aims to achieve a performance three times that of the Nasdaq index.
As the below chart shows, one share of TQQQ is valued at $74.21 per share.

On the surface, the two charts of QQQ and TQQQ look similar.
You will later see that they are not the same.
Let’s use some real numbers and look at what happened on April 9, 2025 – the day with that big green candle off the lows.
One share of QQQ went from $415.57 at the open to $466.00 at the close – an increase in price of 12%.
On that same day, TQQQ went from $38.76 at the open to $52.61 at the close – an increase of 35%.
In percentage terms, TQQQ went up three times as much as the QQQ.
We say that TQQQ is a three-times leveraged ETF of the QQQ.
An easy way to remember this is to think of the T in TQQQ as “Triple QQQ.”
Some investors who are bullish on the Nasdaq may want to buy the TQQQ instead of QQQ in the hopes of tripling their performance.
However, they also take on three times the risk (in percentage terms).
Take a look at the big red candle on February 27, 2025, when TQQQ dropped by 10% from $79.49 to $71.43 from open to close.
On the same day, QQQ dropped by only 3.4% from $517.36 to $499.53.
Let’s say that investor A had $10,000 of TQQQ at the start of February 27 – that would be 125.80 shares (calculated by $10,000 / $79.49)
Let’s say that investor B had $10,000 of QQQ – that would be 19.33 shares (calculated by $10,000 / $517.36).
At the end of the day, Investor A’s account would have a value of $8,985, as calculated by 125.80 x $71.43.
The investor B account would have a value of $9,655 as calculated by 19.33 x $499.53.
Investor A’s account dropped by about 10%, while Investor B’s account dropped by about 3.45%
Let’s say Investor A had $1,000 worth of TQQQ at the start of April, with 25.80 shares.
Say investor B had $3,000 worth of QQQ or 7.22 shares.
At the end of the day, investor A would have $1,357, as calculated by 25.80 x $52.61.
This is a profit of $357.
Investor B would have $3,364.52 as calculated by 7.22 x $466.
This is a profit of $364.52.
They both make about the same in profit.
But one dollar of TQQQ works three times as hard.
To put it in other words, you need one-third less dollars of TQQQ to make the same as you would QQQ.
QQQ started the year 2025 on January 2 at $513.53 and ended the month of May at $519.11 on May 30.
Suppose a QQQ investor invested $10,000 with 19.473 shares of QQQ.
At the end of five months, the QQQ investor has $10,108 (because $519.11 x 19.473), which is a profit of $108.
Suppose a TQQQ investor invested $10,000 with 124.533 shares of TQQQ during the same period.
At the end of five months, the TQQQ investor has $70 x124.533 = $8717.
This is a loss of $1283.
You can confirm that this is the case because TQQQ opened at $80.30 on January 2 at the beginning of the year and ended at $70 on May 30.
How can it be that TQQQ went down while QQQ went up?
Isn’t the TQQQ supposed to track the QQQ with three times leverage?
In theory, it is.
But look at the charts.
There was a big volatility event, with the Nasdaq dropping about 24% from peak to trough.
This is when beta slippage negatively impacts leveraged ETFs, such as the TQQQ.
Beta slippage does not affect non-leveraged ETFs, such as QQQ.
Beta slippage (also called volatility decay or path decay) is a phenomenon in leveraged ETFs where the fund’s long-term performance deviates negatively from the expected multiple of the underlying index’s return.
This is minimal over a single day, but its effects worsen over weeks or months.
The more back-and-forth movement of the underlying, the worse the decay – even if the index returns to the same price.
This is due to the daily compounding effect, as the fund needs to rebalance on a daily basis.
Leveraged ETFs like TQQQ can be useful for short-term investors to capitalize on market direction by using small capital to achieve a greater return (provided that they predicted the direction correctly).
However, it is not ideal for long-term holding due to beta slippage.
We hope you enjoyed this article on the difference between TQQQ and QQQ ETFs.
If you have any questions, send an email or leave a comment below.
Trade safe!
Disclaimer: The information above is for educational purposes only and should not be treated as investment advice. The strategy presented would not be suitable for investors who are not familiar with exchange traded options. Any readers interested in this strategy should do their own research and seek advice from a licensed financial adviser.
