
In the world of automated trading, we’re always on the hunt for an edge. We build complex Expert Advisors (EAs), backtest countless strategies, and optimize every parameter. But what if one of the most powerful tools for enhancing profitability and managing risk isn’t a complex algorithm, but a simple statistical concept?
Enter pair correlation.
It’s a term you’ve likely heard, but many traders on the MQL5 platform only scratch the surface of what it can do. Understanding how different currency pairs and assets move in relation to one another is like having a secret map of the market. It can help you dodge hidden risks, confirm your trade signals, and even open the door to sophisticated strategies like pairs trading.
This guide will take you from the basics of correlation to its practical implementation in MQL5, giving you the knowledge to build smarter, more robust trading systems.
What Exactly is Pair Correlation? 📈
At its core, correlation is a statistical measure that expresses the extent to which two variables are linearly related, meaning they change together at a constant rate. In finance, it tells us how the prices of two assets—like EUR/USD and GBP/USD—tend to move in relation to each other.
This relationship is measured by the correlation coefficient, usually denoted by the Greek letter rho (ρ) or simply as r. The value of this coefficient ranges from -1.0 to +1.0.
-
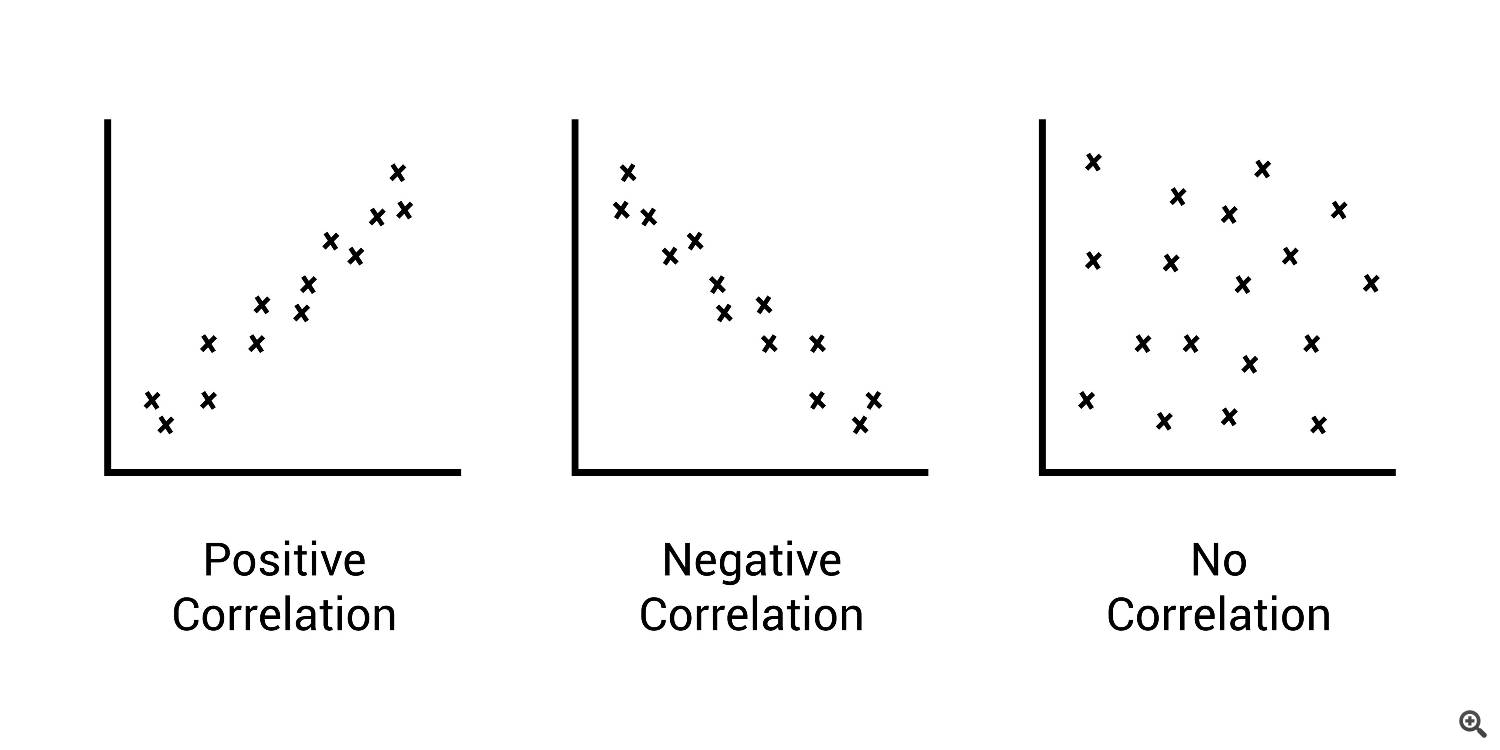
Positive Correlation (+1.0): This means two assets move in the same direction. If Asset A goes up, Asset B tends to go up as well. A perfect positive correlation of +1.0 means they move in perfect lockstep. Think of two elevators starting on the ground floor and traveling up together. A common example in Forex is AUD/USD and NZD/USD, as both economies are closely tied to commodity prices and their neighbor, Australia.
-
Negative Correlation (-1.0): This means two assets move in opposite directions. If Asset A goes up, Asset B tends to go down. A perfect negative correlation of -1.0 means they are perfect mirror images. Think of a seesaw. A classic example is EUR/USD and USD/CHF. Because USD is the base currency in one and the quote currency in the other, a strengthening dollar will often push EUR/USD down and USD/CHF up.
-
Zero Correlation (0.0): This implies there is no discernible linear relationship between the movements of the two assets. Their price changes are essentially random relative to each other.
For the mathematically inclined, the most common formula used is the Pearson correlation coefficient:
r=∑(xi−xˉ)2∑(yi−yˉ)2∑(xi−xˉ)(yi−yˉ)
Where:
Don’t worry, you won’t need to calculate this by hand! MetaTrader 5 can do the heavy lifting for you.
Why Pair Correlation Matters for MQL5 Traders
Understanding this concept is more than just a fun fact; it has direct, practical applications for your trading.
1. Superior Diversification and Risk Management
Many traders believe they are diversified because they trade multiple currency pairs. However, if you are long on EUR/USD, GBP/USD, and AUD/USD simultaneously, you are not diversified. These pairs are all positively correlated because they share the USD as the quote currency. If the US dollar strengthens across the board, all your positions will likely move against you.
By analyzing correlation, you can build a truly diversified portfolio. You can ensure your EAs aren’t unknowingly tripling down on the same underlying risk factor. For example, balancing a long EUR/USD position with a long USD/CAD position (a less correlated pair) provides better diversification than simply adding another XXX/USD pair.
2. The Power of Pairs Trading (Statistical Arbitrage)
This is where things get exciting. Pairs trading is a market-neutral strategy that thrives on correlation. The process is simple in concept:
-
Find two highly correlated assets. For example, let’s say a stock like Coca-Cola (KO) and PepsiCo (PEP) historically have a correlation of +0.85.
-
Monitor their price relationship. You might track the ratio of their prices (KO/PEP). Over time, this ratio will have an average (a mean).
-
Wait for a deviation. Sometimes, due to short-term market news, one stock will outperform the other, and the ratio will stretch far from its mean. For instance, KO might have a great earnings report and shoot up while PEP stays flat.
-
Place the trade. Believing the historical relationship will hold, you bet on a “reversion to the mean.” You would short the outperformer (KO) and simultaneously go long the underperformer (PEP).
-
Exit when the relationship reverts. As the price ratio between them returns to its historical average, you close both positions for a profit, regardless of whether the overall market went up or down.
This strategy can be powerfully automated in an MQL5 EA, scanning for correlated pairs and statistically significant deviations (often measured by a Z-score) to trade automatically.
3. Intelligent Hedging
Hedging is about protecting an existing position from adverse moves. Correlation makes this incredibly efficient. Imagine your EA has a large long position on GBP/JPY, but you’re worried about a sudden rise in the Yen’s value. Instead of just closing the trade, you could place a smaller, long position on a pair that is negatively correlated with GBP/JPY, such as USD/CHF. If the Yen does strengthen (causing GBP/JPY to fall), the likely weakness in the USD would cause USD/CHF to also fall, offsetting some of your losses.
Putting It into Practice with MQL5
Theory is great, but how do we actually use this in our code? You have two main options: calculate it yourself or use an existing tool.
Calculating Correlation in MQL5
You can create a function within your EA or indicator to calculate the correlation coefficient between two symbols. Here’s a basic structure of how you would do it.
Step 1: Get Price Data First, you need to populate two arrays with the historical price data (e.g., closing prices) for the symbols you want to compare.
string symbol1 = "EURUSD";
string symbol2 = "GBPUSD";
int lookback_period = 50;


double array1[], array2[];


CopyClose(symbol1, 0, 0, lookback_period, array1);
CopyClose(symbol2, 0, 0, lookback_period, array2);
Step 2: Create a Calculation Function Next, you can use a function to process these arrays and return the correlation coefficient. The Pearson formula can be implemented directly in MQL5.
double CalculateCorrelation(const double &arr1[], const double &arr2[], const int count)
{
   if(count <= 1) return 0.0;

   double sum_X = 0, sum_Y = 0, sum_XY = 0;
   double squareSum_X = 0, squareSum_Y = 0;

   for(int i = 0; i < count; i++)
   {
      sum_X += arr1[i];
      sum_Y += arr2[i];
      sum_XY += arr1[i] * arr2[i];
      squareSum_X += arr1[i] * arr1[i];
      squareSum_Y += arr2[i] * arr2[i];
   }


   double numerator = (double)(count * sum_XY - sum_X * sum_Y);
   double denominator_part1 = (count * squareSum_X - sum_X * sum_X);
   double denominator_part2 = (count * squareSum_Y - sum_Y * sum_Y);

   if(denominator_part1 <= 0 || denominator_part2 <= 0) return 0.0;

   double corr = numerator / sqrt(denominator_part1 * denominator_part2);

   return corr;
}
By integrating this into your EA, you can make dynamic decisions. For example: “Only take a long trade on EUR/USD if its 50-period correlation with GBP/USD is above 0.7.”
Using MQL5 Marketplace Indicators
Want to save time? The MQL5 Marketplace is filled with powerful indicators that can display the correlation between assets directly on your chart, often as a simple line oscillating between -1 and +1. These tools are fantastic for visual analysis and can be called from your EA using the iCustom() function.
The Big Warning: Correlation Pitfalls ⚠️
Before you build your entire strategy around this concept, you must understand its limitations.
-
Correlation is NOT Causation. Just because two assets move together doesn’t mean one is causing the other to move. A third, unseen factor (like the strength of the US dollar) could be influencing both. Never assume causality.
-
Correlations are Dynamic. The relationship between pairs can and will change. A +0.80 correlation can break down to +0.20 in a matter of days during major news events (like Brexit) or shifts in central bank policy. This is called correlation breakdown, and it can destroy strategies that assume a static relationship. Always use a rolling correlation calculation rather than a single, long-term value.
-
Lookback Period Matters. A correlation calculated over 20 periods will be very sensitive and “noisy.” A calculation over 200 periods will be smoother but slower to react to changes. Finding the right lookback period is crucial and depends on your trading style.
Final Thoughts
Pair correlation isn’t a holy grail. It’s not a standalone strategy that guarantees profits. Instead, think of it as a powerful lens through which you can view the market.
By mastering correlation, you can move beyond single-asset analysis and start understanding the intricate web of relationships that drives the financial world. You can build more resilient EAs, manage risk more intelligently, and unlock sophisticated strategies that are out of reach for most retail traders.
So, dive in. Check out a correlation indicator from the MQL5 Marketplace. Add a correlation filter to your existing EA. Start exploring the powerful world of pairs trading. You might just discover the edge you’ve been looking for.