
This article explains what harmonic patterns are, how traders use them in different markets (especially Forex), and how they connect with Fibonacci ratios, all based on the work of Scott M. Carney.
Who is Scott M. Carney?
Scott M. Carney is the president and founder of HarmonicTrader.com.
He developed a full trading approach based on price pattern recognition and Fibonacci measurements, known as Harmonic Trading.
He introduced and named several popular harmonic patterns such as:
-
The Bat Pattern
-
The Gartley Pattern
-
The Crab Pattern
Carney also introduced key concepts like the Potential Reversal Zone (PRZ) and important Fibonacci levels such as 0.886 and 38.2% retracements.
He is a member of the Market Technicians Association (MTA) and the American Association of Professional Technical Analysts (AAPTA).
He has published four books on harmonic trading:
-
The Harmonic Trader (1999)
-
Harmonic Trading of the Financial Markets, Volume 1 (2004)
-
Harmonic Trading of the Financial Markets, Volume 2 (2007)
-
Harmonic Trading, Volume 3: Reaction vs Reversal (2016)
What Are Harmonic Patterns?
Harmonic trading helps traders identify high-probability reversal points in the market.
This approach assumes that market movements — like many natural cycles — tend to repeat themselves.
The goal is to identify these recurring price patterns and trade them when the probability of a trend change is high.
Harmonic patterns work on all timeframes — from intraday charts (1H, 4H) to daily and weekly charts.
Swing traders often prefer daily charts, while short-term traders find many opportunities on lower timeframes.
The Core Idea
The most important part of harmonic trading is recognizing specific price cycles that follow precise Fibonacci ratios.
These ratios help traders identify potential reversal zones (PRZ) — areas where the natural rhythm of the market is likely to change direction.
These reversals happen because of crowd psychology — traders tend to react in similar ways at certain Fibonacci levels.
However, not all PRZ zones work perfectly.
It’s important to analyze price action around these zones and look for confirmation signals such as candlestick patterns, volume, or divergences.
If strong continuation candles or gaps appear, the pattern might be invalid.
Always wait for confirmation before entering a trade.
Validating Harmonic Patterns
Each pattern has strict rules based on Fibonacci ratios.
Even small differences can make a pattern invalid.
For example:
The B point is critical — it helps distinguish between similar-looking patterns like the Bat and the Gartley.
At the PRZ (Potential Reversal Zone), traders can use volume or divergence indicators to confirm whether the price is ready to reverse.
The Core AB=CD Pattern
The AB=CD pattern is the foundation of most harmonic structures.
It represents a measured and symmetrical move in price that completes inside the PRZ.
The Main Harmonic Patterns by Scott Carney
Below are the most well-known harmonic patterns, their characteristics, and what they tell traders.
1. The Gartley Pattern
Discovered by H.M. Gartley, this is the original harmonic pattern.
It signals potential reversals using Fibonacci retracements and extensions.
Key features:
-
5 points (X, A, B, C, D)
-
AB = 61.8% retracement of XA
-
BC = 38.2% or 88.6% of AB
-
CD = 127.2% (if BC = 38.2%) or 161.8% (if BC = 88.6%) of BC
-
CD = 78.6% retracement of XA
-
D = PRZ (Potential Reversal Zone)
📈 Example: Bullish and Bearish Gartley patterns on EUR/USD (H4)

📈 Example: Bearish Gartley patterns on EUR/USD (H4)

2. The ABCD Pattern
The simplest harmonic pattern with 4 points and 3 price swings.
Once legs AB and BC are defined, the length of AB is projected from point C to find point D.
Key features:
-
BC = 61.8% or 78.6% of AB
-
CD = equal to AB (AB=CD)
-
Extensions can be 127.2% or 161.8%
-
D = completion point and PRZ
📈 Example: Bullish AB=CD on EUR/JPY (H1)

📈 Example: Bearish AB=CD on Gold Daily.

3. The Bat Pattern
Discovered by Scott Carney in 2001, this is one of the most accurate harmonic setups with a high success rate.
Key features:
-
B point retracement: 38.2%–50% of XA (below 0.618)
-
BC retracement: 38.2%–88.6% of AB
-
CD retracement: up to 88.6% of XA
-
CD extension: 161.8%–261.8% of AB
-
D = PRZ for potential reversal
📈 Example: Bullish Bat on SP500 (Daily)

📈 Example: The Bearish Bat on JP MOrgan Chase (H1)

4. The Crab Pattern
Another precise pattern from Scott Carney (2000).
It often shows very sharp reversals near the PRZ.
Key features:
-
AB = ≤ 61.8% of XA
-
BC = 38.2% or 88.6% of AB
-
CD = 161.8% extension of XA
-
CD extension: 224%–361.8% of BC
-
D = PRZ (Potential Reversal Zone)
📈 Example: Bullish Crab on Facebook (15min)

📈 Example: Double Bearish Crab Dow jones (M15).

5. The Butterfly Pattern
Discovered by Bryce Gilmore and refined by Scott Carney.
It looks similar to the Gartley pattern but has different Fibonacci ratios.
Key features:
📈 Example: Bullish Butterfly on GBP/USD (H1)

📈 Example: Bearish Butterfly on NETFLIX (M30)

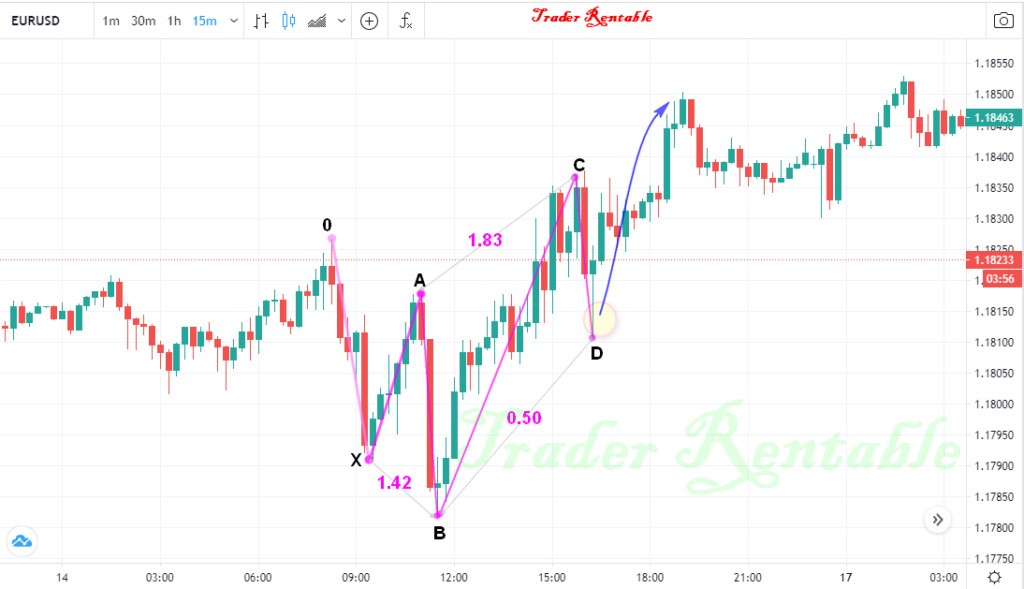
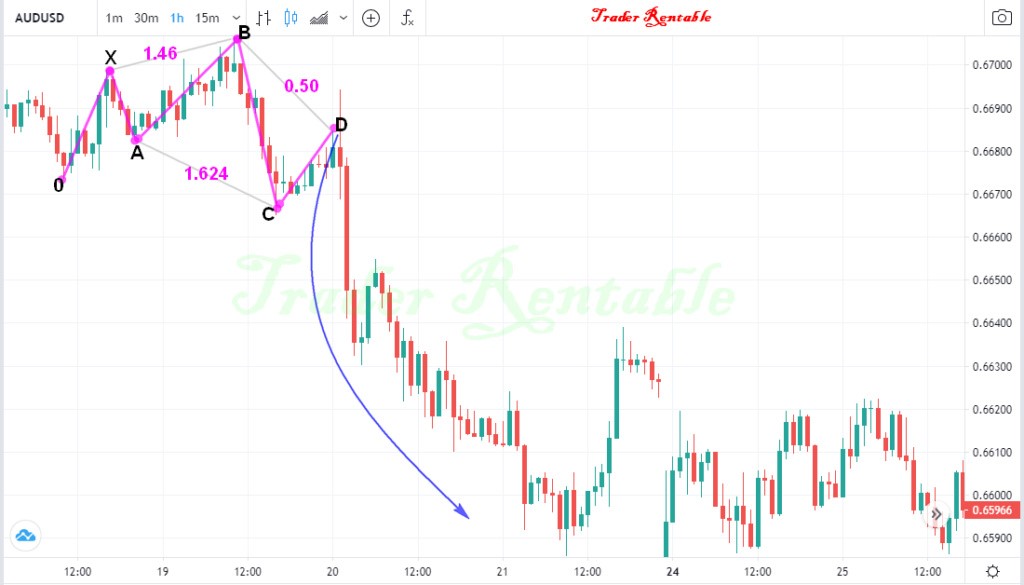
6. The 5-0 Pattern
Introduced in Harmonic Trading Volume 2 by Carney.
It’s a retracement-based pattern that focuses on the 50% level of the BC leg.
Key features:
-
AB = 113%–161.8% extension of XA
-
BC = 161.8%–224% extension of AB
-
CD ends near 50% retracement of BC
-
D = PRZ (entry point)
📈 Example: Bullish 5-0 on EUR/USD (15min)
📈 Example: Bearish 5-0 pattern on AUD/USD (H1) .
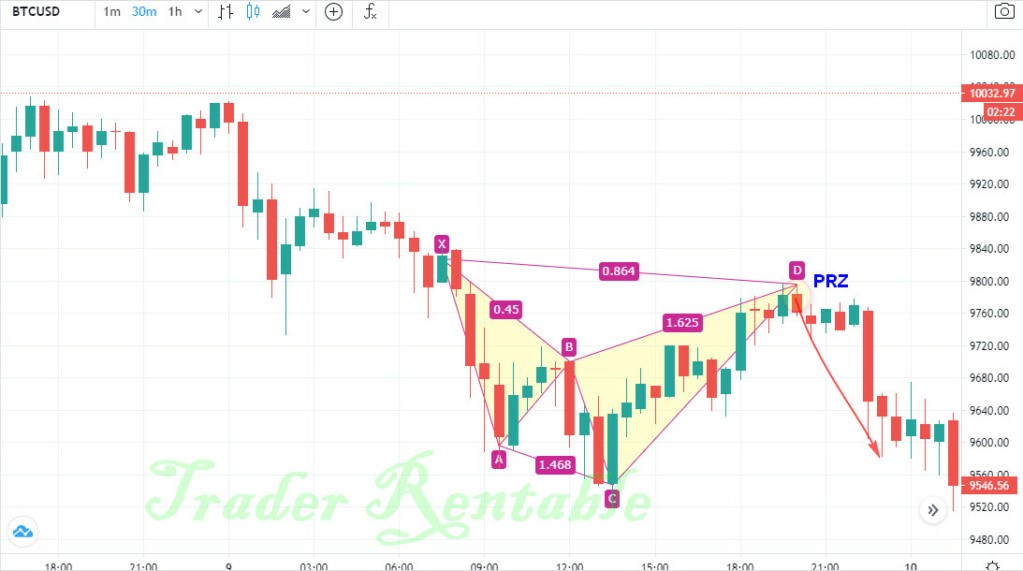
7. The Shark Pattern
Discovered by Scott Carney in 2011, the Shark pattern is similar to the Crab but includes an extended C leg.
Key features:
📈 Example: Bullish Shark on Nikkei 225 (5min)

📈 Example: Bearish Shark, Bitcoin (M30).
Conclusion
Harmonic trading is an advanced technical analysis method that combines chart patterns with Fibonacci ratios to identify potential turning points in the market.
It can be applied to Forex, stocks, crypto, and commodities — on any timeframe.
However, it requires patience, practice, and strict money management.
Invalid ratios mean invalid patterns — and that’s where many new traders make mistakes.
Always confirm with candlestick signals, volume, or momentum indicators like MACD before entering a trade.
Combining harmonic patterns with confirmation tools helps you take high-probability trades with minimal risk and strong profit potential.
Our Blog posts
Excel ProTrading Analytics Template
Quantitative Trading Analysis Toolkit
Quantitative Analysis of Dynamic Fibo Scalper