
If you were previously unimpressed by TradingView’s stock screener, make sure you are looking at TradingView’s completely new stock screener instead of its legacy stock screener.
Contents
The newer version of the stock screener can be accessed on TradingView.com by clicking on the right-hand sidebar icon that looks like a radar:
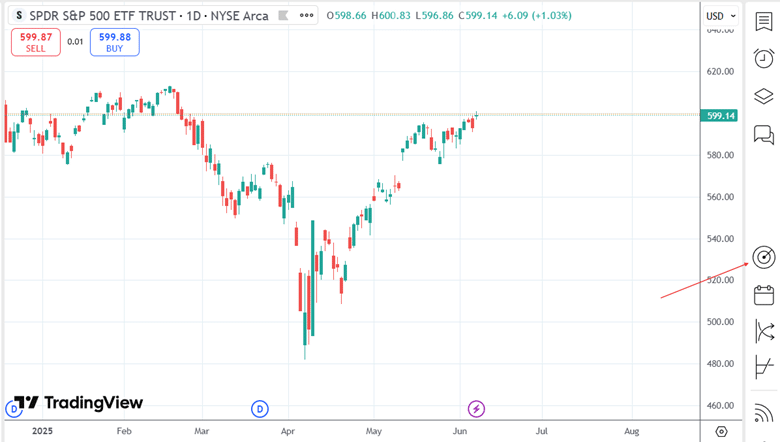
Ensure you are using the desktop version of the web application.
If you are viewing it on your phone, this icon will not be available.
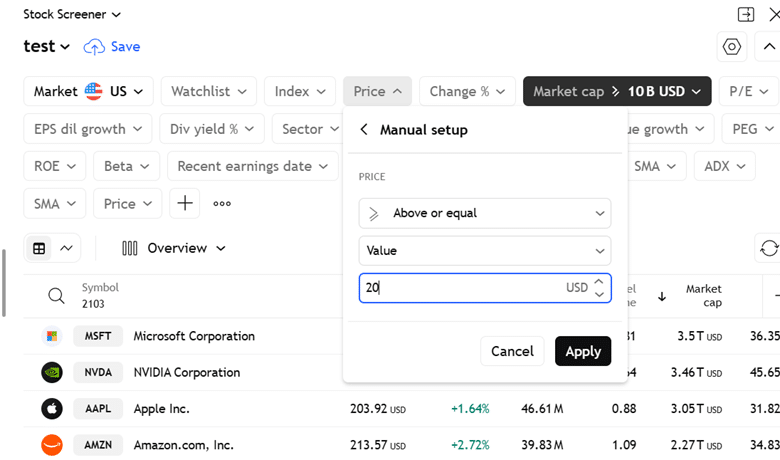
In the screenshot below, I have initiated a new scan by resetting all filters and selected the U.S. market for stocks with a market capitalization greater than $ 10 billion.
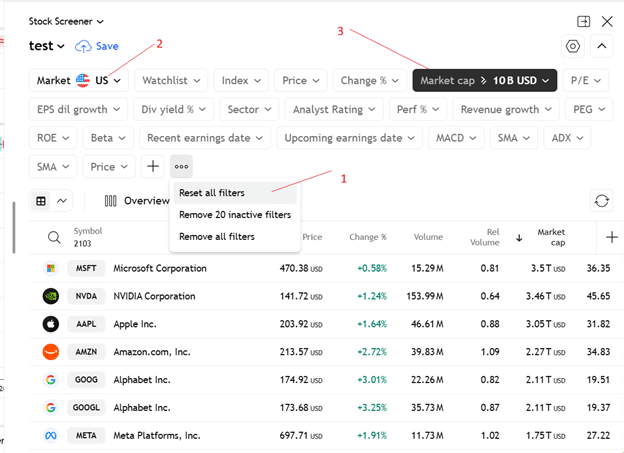
If I wanted only stocks with a price per share of greater than $20, I do not see that option in the price dropdown:
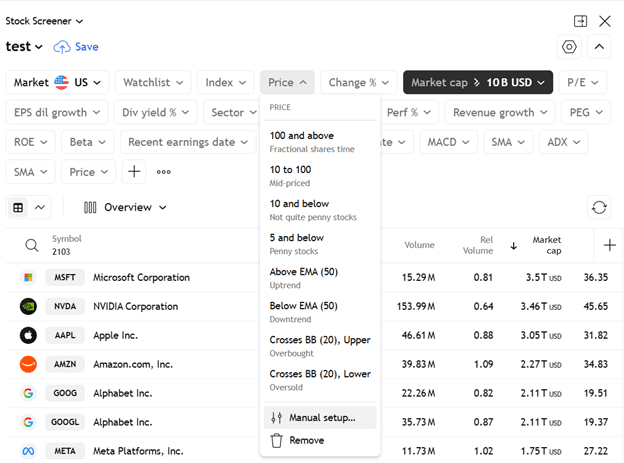
So, I go to “Manual setup” to configure the price value to be greater than or equal to 20…
If you do not see a criteria dropdown that you are looking for, click on the plus icon as shown below:
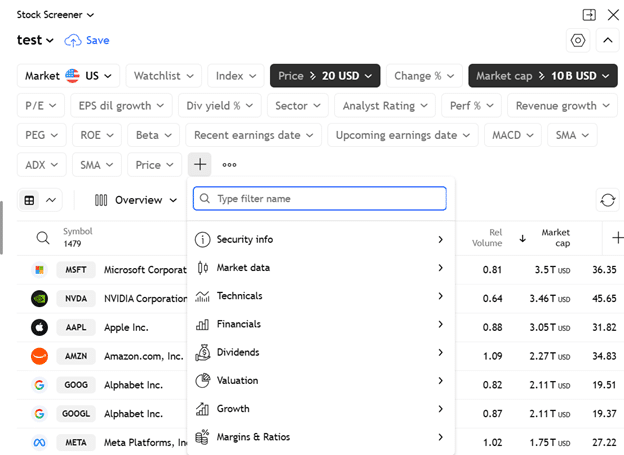
You can scan by fundamental criteria or by technical criteria.
Within the Technicals, you can scan by various indicators:
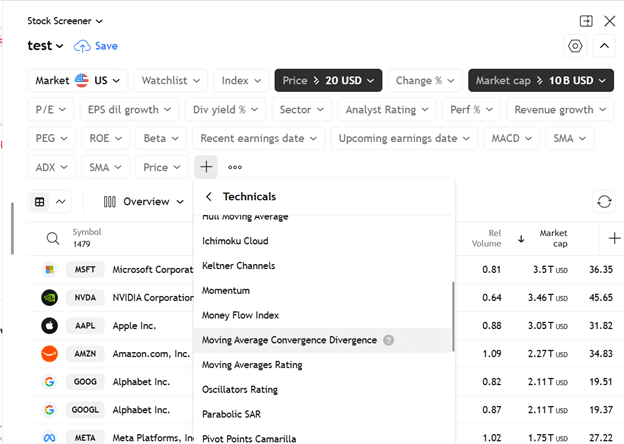
In the above screenshot, I am selecting MACD (Moving Average Convergence Divergence).
Before we get into scanning in multiple timeframes, let’s work with a more complex example within the single daily timeframe first.
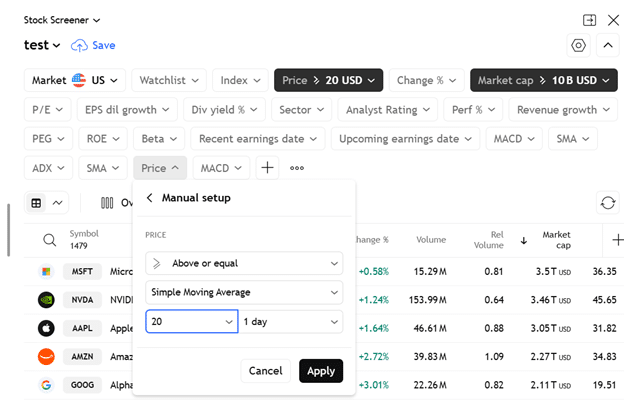
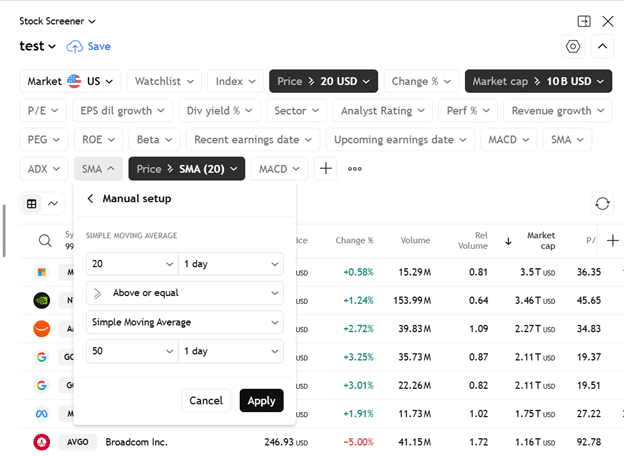
Suppose I want to identify stocks that are trading above their 20-day simple moving average.
And I want its 20-day SMA to be about the 50-day moving average.
I also want the 50-day Simple Moving Average (SMA) to be above its 200-day moving average.
First, we add another price filter (in addition to the existing one) and configure it to look for stock prices above their 20-day moving average.
See below.
Next, we configure the SMA (simple moving average) filter such that the 20-day is greater than or equal to the 50-day.
We do that as shown below:
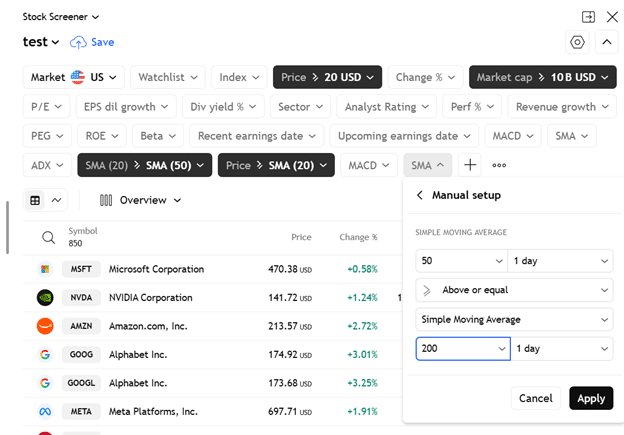
Finally, we add a second SMA filter to configure the last criteria of 50-SMA greater than or equal to 200-SMA:
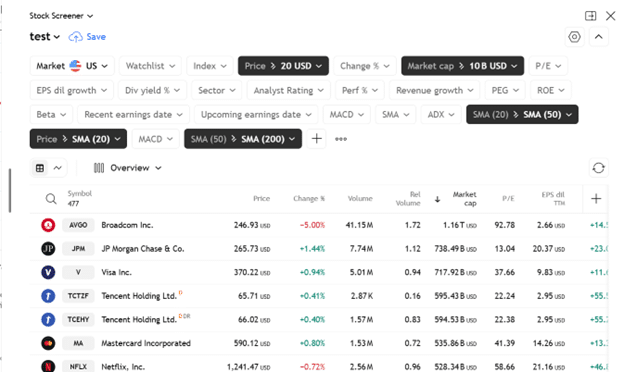
Here are the results in the list view:
Here are the results in thumbnail view:
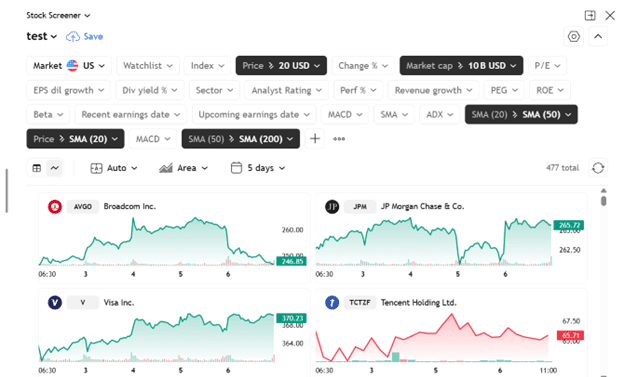
It is always good to confirm in the charts that that scan is doing what we intend.
So, I put the chart and the results side by side:
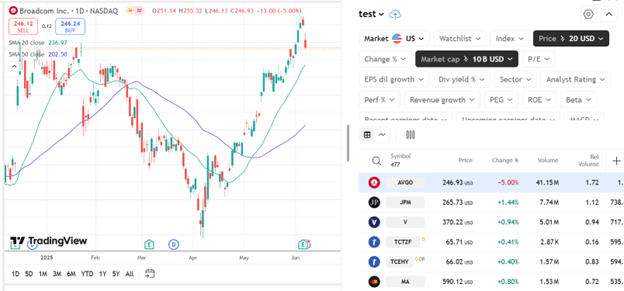
As I click on the stocks in the results list, I can confirm that the price is above the 20-SMA (green line), which, in turn, is above the 50-SMA (blue line).
Now for the feature that we have been waiting for – scanning for stocks based on technicals involving multiple timeframes.
Suppose I want to find stocks that are above the 20-period simple moving average on the weekly chart.
And at the same time, its Stochastic is in oversold condition on the daily chart.
First, we set the Price filter to be greater than or equal to a 20-week simple moving average (SMA):
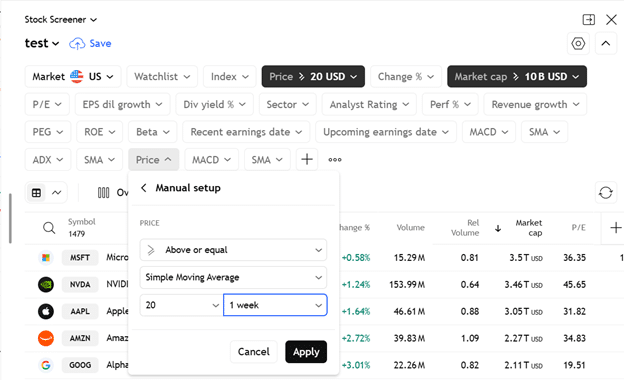
Note that there is a dropdown to select the weekly timeframe.
Next, we set Stochastics to be below 25 on the daily timeframe:
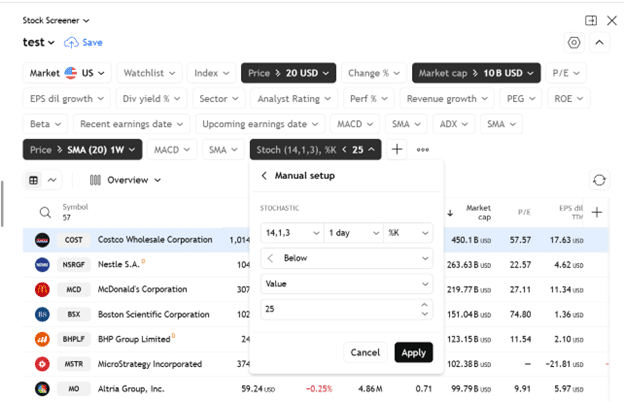
To achieve this, we ensure the dropdown is set to “1 day” for the daily timeframe.
Costco is among the results.
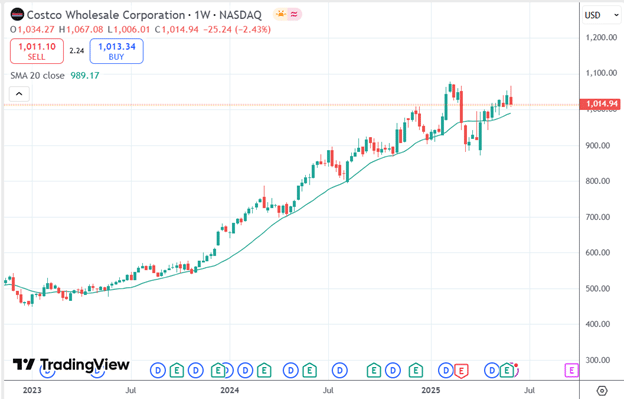
We can confirm that Costco is above the 20-SMA on the weekly chart, indicating a bullish long-term trend:
At the same time, it is oversold in the shorter-term daily chart:
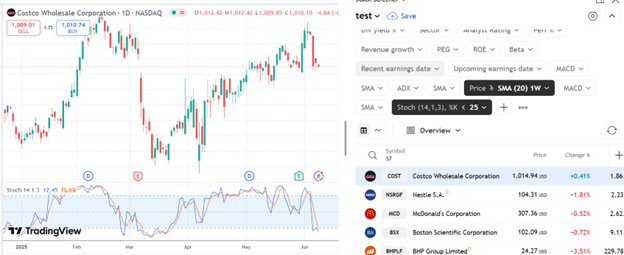
So this might be a good “buy-the-dip” trade idea.
Can I filter by any technical indicators?
No.
Certain technical indicators that you can apply to the chart you may not find on the scanner. The indicators from third parties will not be present.
Even for some indicators that are native to TradingView, some indicators, such as SuperTrend and Accumulation/Distribution, are not available in the scanner.
As an alternative to the latter, you can perhaps scan for Chaikin Money Flow or the Money Flow Index instead (which are available in the scanner).
Can I change the settings of the MACD indicator that I scan for?
The MACD used by the scanner is set to the default values of 12 and 26.
That is, 12-period for the fast-moving average and 26-period for the slow-moving average.
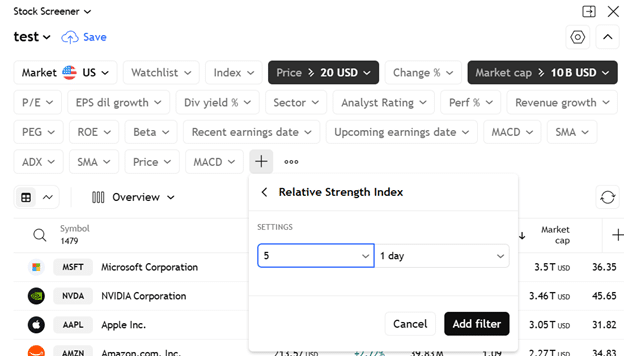
However, the settings of other indicators, such as the RSI, can be changed.
Below, I’m configuring the RSI to be a 5-period RSI instead of the default 20-period RSI…
There are numerous stock scanners available.
But not that many can search criteria in multiple time frames simultaneously.
And fewer that are free.
Now you know of at least one.
We hope you enjoyed this article on TradingView’s multi-timeframe stock screener.
If you have any questions, send an email or leave a comment below.
Trade safe!
Disclaimer: The information above is for educational purposes only and should not be treated as investment advice. The strategy presented would not be suitable for investors who are not familiar with exchange traded options. Any readers interested in this strategy should do their own research and seek advice from a licensed financial adviser.
