
Professional traders enter trades only when market conditions align with their strategy.
Many trading strategies perform best in stable market environments.
Today, we’ll explore the key metrics used to identify whether the market is in a steady uptrend or a volatile downtrend.
Contents
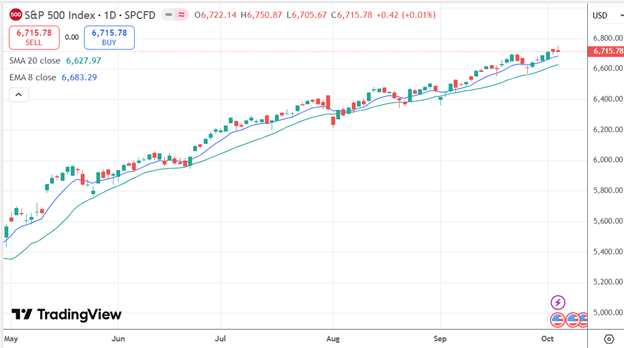
Moving averages are one of the quickest and simplest tools for assessing market conditions.
The choice of period length and whether to use a simple or exponential moving average depends on the trader’s preference and trading timeframe.
Many traders favor the 20-period simple moving average.
While longer-term traders might opt for the 50-period moving average, shorter-term traders might prefer the 8-period exponential moving average (8-EMA).
In either case, the key is to observe whether the price is above the moving average and whether the line is sloping upward.
The market tends to be stable if that is the case.
For example, May through September of 2025 showed stability as SPX was above both the upward sloping 8-EMA (blue line) and the upward sloping 20-SMA (green line) most of the time…
The VIX, often referred to as the “fear index,” measures the market’s expectation of volatility in the S&P 500.
A low VIX below 25 indicates a stable, calm market environment.
The VIX is the expectation of volatility in the S&P 500 over the next 30 days.
A VIX value of 25 means a statistically equivalent of a 25% annualized volatility over the next 30 days.
When the VIX begins to rise or remains elevated, it signals growing uncertainty and the potential for increased market volatility.
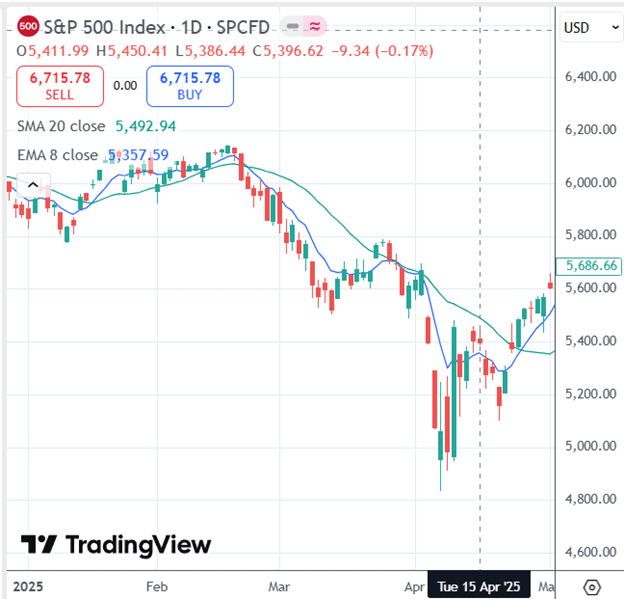
Most of April 2025 showed the VIX being above 25:
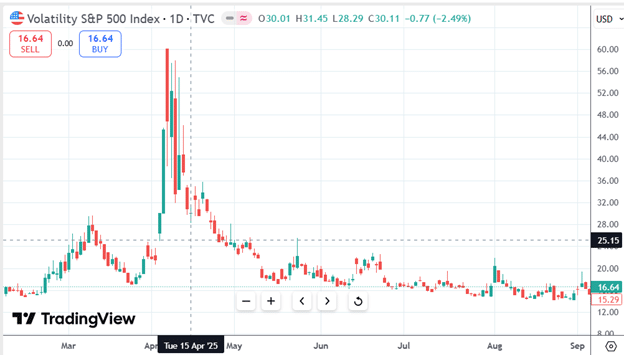
And this is characteristic of a downtrending market with increased volatility:
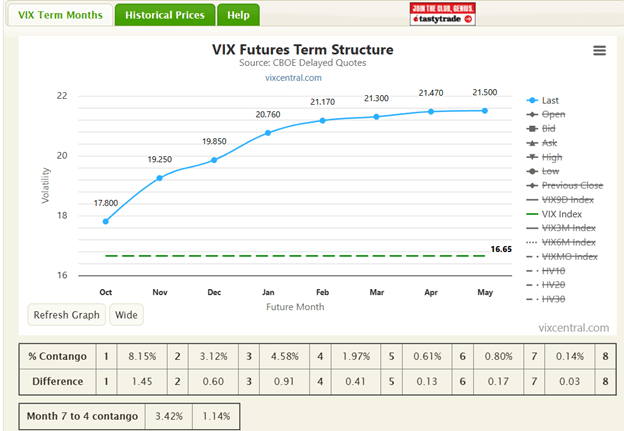
In normal markets, the VIX Futures term structure should show a contango of greater than 1.5%.
Below, we see a healthy percent contango at 8.15% between the first two months:
But when the term structure goes into backwardation, watch out.
Backwardation is when the volatility of the first month is higher than that of the following month.
For example, the VIX Futures term structure was in backwardation as of January 21, 2022:
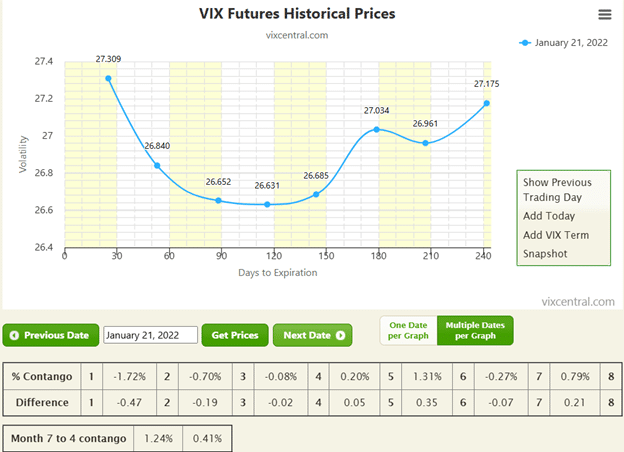
There was foreshadowing the day before, when the percent contango dropped from 1.5% to 0.5%.
The Average True Range (ATR) indicator measures the average size of price movements, or candles, on the chart.
In a stable market, candles tend to be small to moderate in size, and the ATR generally decreases as volatility subsides.
Conversely, when the ATR begins to rise, it signals expanding price ranges and the potential for increased volatility.
There is no hard value of ATR to compare against.
We typically want to compare the current ATR with the ATR range over the past two to three months.
Take a look at the ATR indicator for October 2023 on SPX:

Its ATR is increasing higher than it has been for the past three months.
We might like to think that we can tell when the candle size is increasing.
But sometimes it is not so obvious.
Enabling the ATR indicator makes it more obvious.
The Relative Strength Index (RSI) measures the strength and momentum of price movements averaged over 14 days.
This is known as the 14-period RSI, which is the default.
However, its period settings can be changed.
When the RSI is between 55 and 80, it suggests a strong and stable market that is not yet overextended.
Conversely, an RSI reading below 50 indicates weakening momentum and a potentially soft or declining market trend.
Note in the above chart that the RSI during October 2023 was below 55 the whole time, suggesting that this was not a good month for bullish strategies (generally speaking).
Breadth indicators, such as the percentage of S&P 500 stocks trading above their 50-day moving average, help gauge the overall strength and participation within the market.
A strong market typically shows broad participation, with a large proportion of stocks remaining above their key moving averages.
Traders may also use the 20-day or 200-day moving average to assess shorter or longer-term market breadth, depending on their time frame.
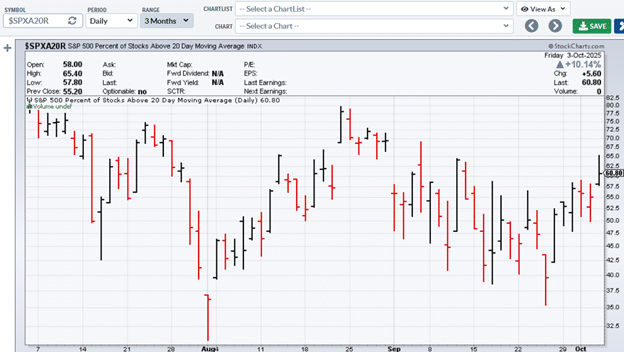
In Barchart, $S5TW is the symbol for the percentage of S&P 500 stocks above their 20-day moving average.
$S5FI is the symbol for above its 50-day moving average.
In StockCharts, the corresponding symbols are $SPXA20R and $SPXA50R, respectively.
Percentages above 55% indicate good participation.
The chart below shows 60% of S&P 500 stocks are above their 20-day moving average:
And 59% are above its 50-day moving average:
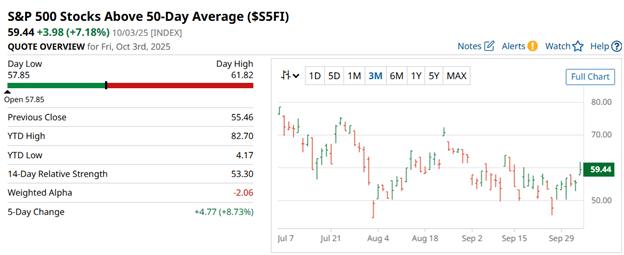
Source: barchart.com
This suggests that there is enough participation to keep the upward drift of the market continuing.
It is essential to evaluate overall market conditions before entering any trade.
Today, we discussed several key metrics that can help assess whether the market is stable or volatile.
These include moving averages, the Average True Range (ATR), the VIX, the Relative Strength Index (RSI), and breadth indicators.
By reading these, the investor and trader can better decide how much risk to expose themselves to in the market.
When market conditions are good, they will put more of their money into the market.
We say it is “risk on”.
When market conditions are no longer good, they take the risk off the table.
It is “risk off”.
We hope you enjoyed this article on the metrics to determine market conditions.
If you have any questions, please send an email or leave a comment below.
Trade safe!
Disclaimer: The information above is for educational purposes only and should not be treated as investment advice. The strategy presented would not be suitable for investors who are not familiar with exchange traded options. Any readers interested in this strategy should do their own research and seek advice from a licensed financial adviser.
