
George Lane developed the stochastics indicator in the 1950s.
It is in the category of momentum indicators.
It is also an oscillator, which means that its value can range from 0 to 100, and nothing outside of that range.
Contents
Values of above 80 on the stochastics are considered to indicate that the stock is “overbought”.
Low values below 20 on the stochastics indicator are considered “oversold”.
An overbought stock can remain overbought for a long time.
While it stays overbought, its price can continue to go up, and a trader shorting it may take on large losses.
Similarly, an oversold stock can stay oversold for a long time.
Therefore, a better way is to wait for the stochastics to come out of overbought or oversold before buying or selling.
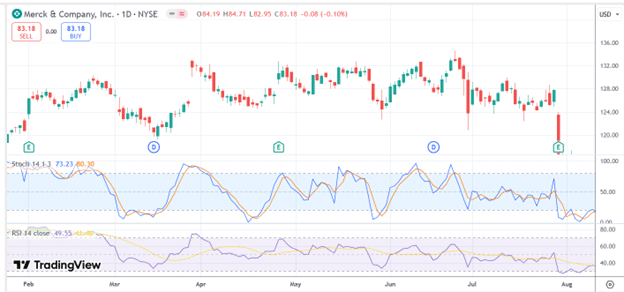
Here is Merck (MRK) with the stochastic indicator having a blue background when the stochastic is above 20 and below 80.
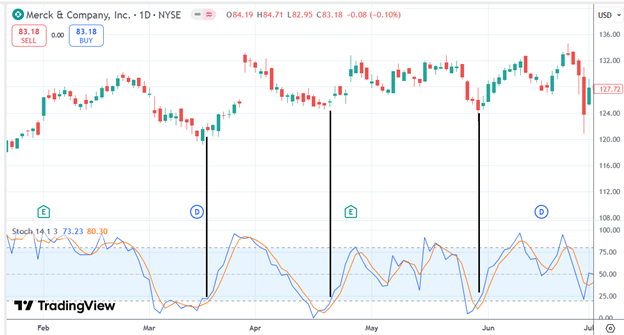
At the three instances marked, we see that the price goes up as the stochastics come out of the oversold area (the bottom white area).
These would be good buy points for a small bullish trade to be exited when the stochastics reaches the oversold area (the top white area above 80).
There are two lines in the indicator.
Which line do we look at?
We look at the blue line.
This is the stochastics line, also known as the “fast” line, because it has more movement, twists, and turns than the “slower” red signal line.
The fast line is the %K line and is the actual stochastics calculations:
%K = (Closing price – 14-period low ) / (14-period high – 14-period low ) × 100
Its calculation looks at the closing price in relation to the high-low range over 14 periods.
The lookback period would be 14 days or 14 candles on a daily candlestick chart.
The %D line is the 3-period simple moving average of the %K line.
It is known as the slow line or the signal line.
While the 14-period lookback and the 3-period moving average can be configured for other numbers, these are the widely used defaults.
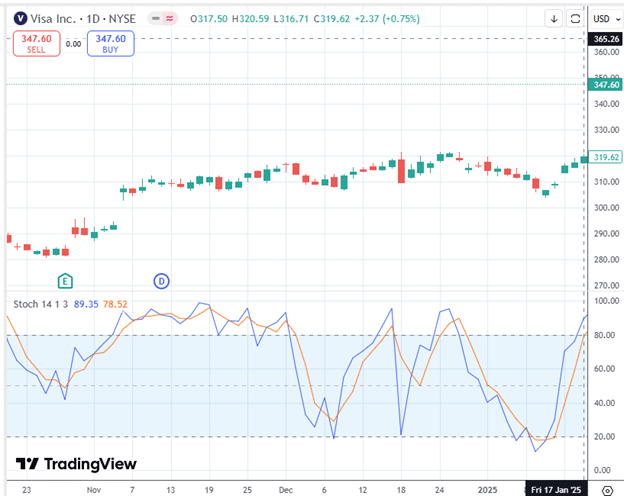
Below is the daily chart of Visa (V) with the blue line being the stochastics line and the red line being the signal line.
On Friday, January 17, 2025, Visa stochastics show overbought.
Knowing that a stock can stay overbought for a while, the trader does not short the stock yet.
And he was wise not to do so because the stock kept going up for another month:
On February 20, the stochastic (blue line) crosses back down below 80, caused by a bearish red candle:
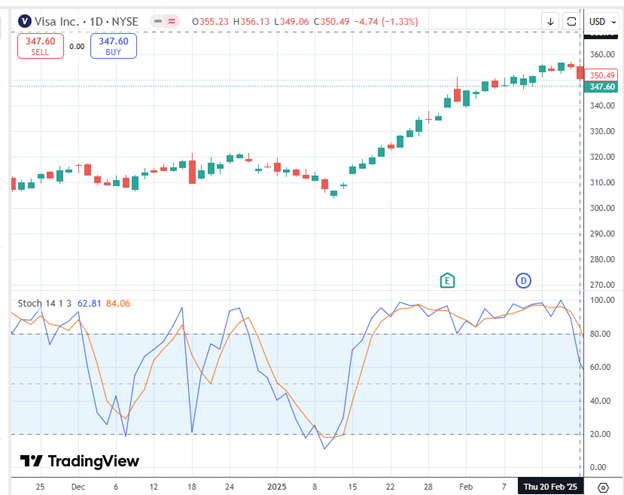
The trader shorts the stock or initiates a bearish call credit options spread.
Sell March 28 V $365 call
Buy March 28 V $370 call
Credit: $100
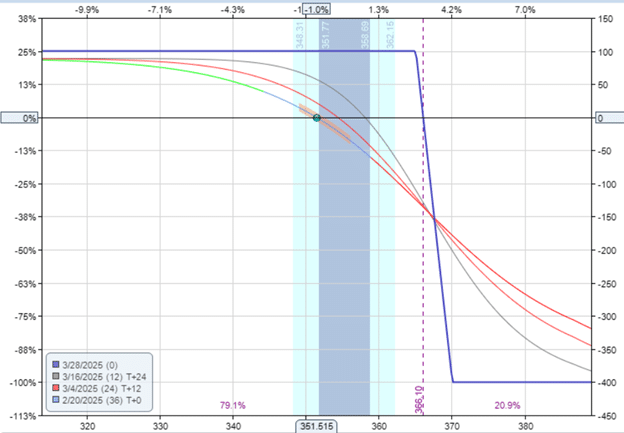
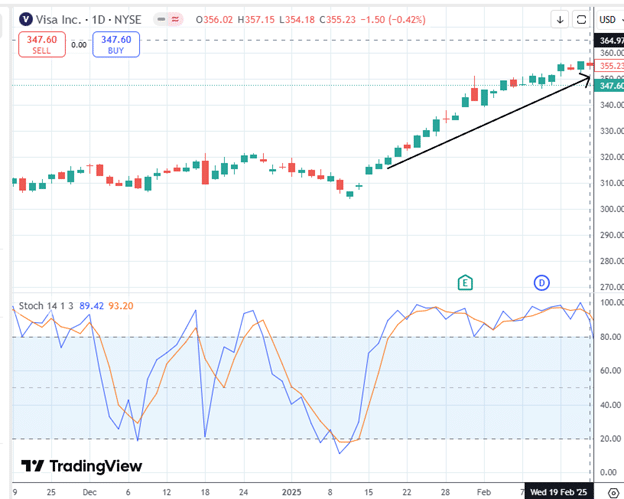
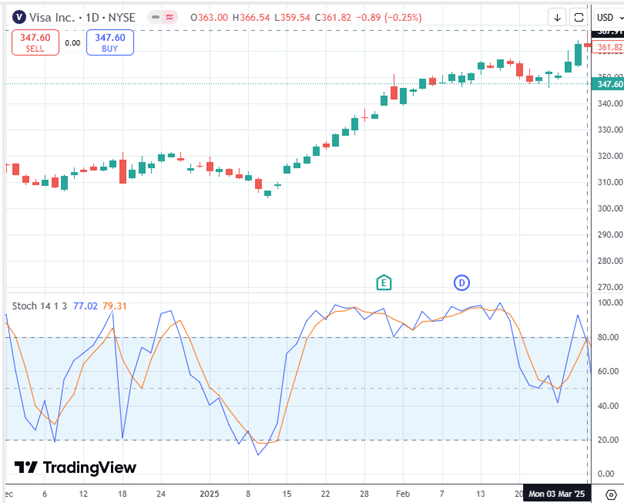
Unfortunately, the stock barely went down that much before it turned up to make a higher high on March 3:
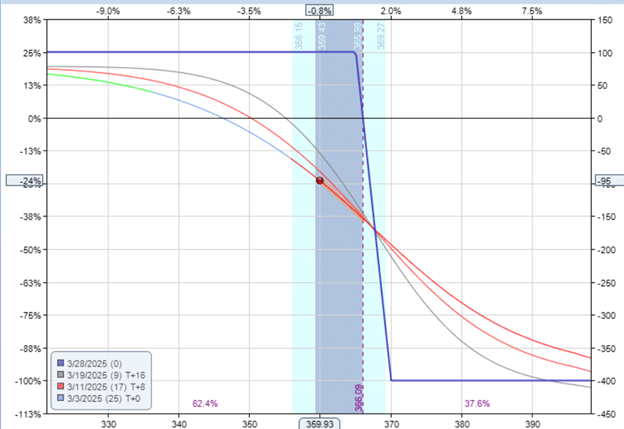
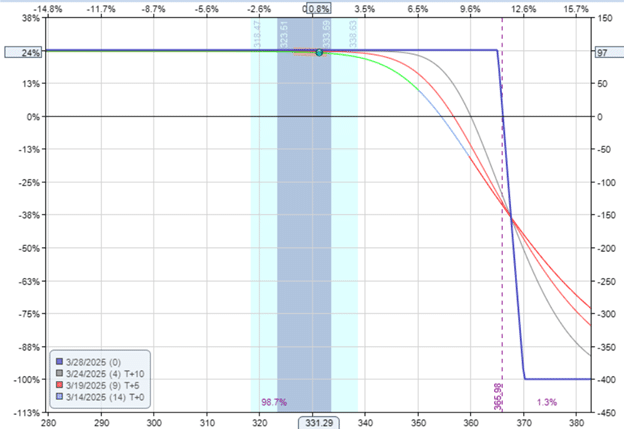
Which causes his bearish trade to be in a drawdown of -$95:
It is at this point that the trader notices the bearish divergence in the stochastics:
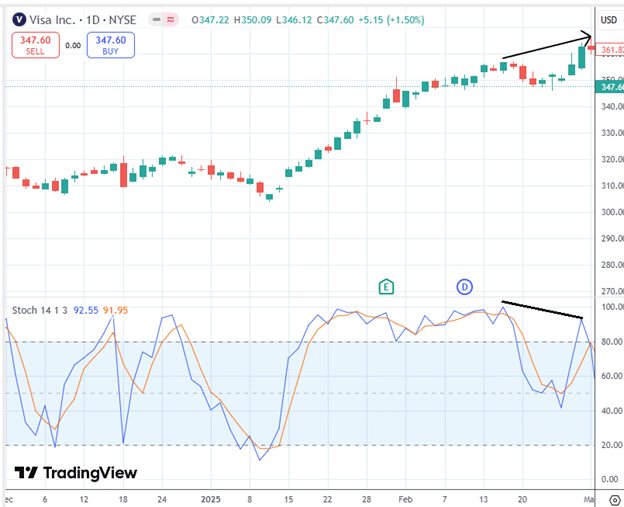
Price was making a higher high, but the stochastic momentum indicator is not confirming this.
In fact, it shows the opposite of slowing momentum, with the blue line forming a lower low.
This is known as a bearish divergence, which suggests a potential bearish move in the stock.
And it did, forming a low on March 14:
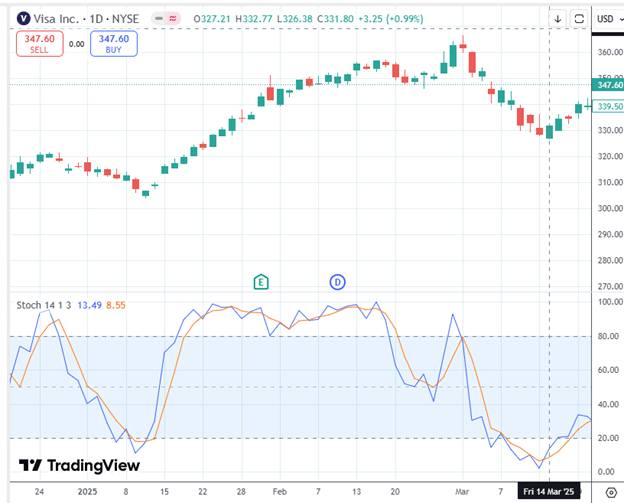
The stochastics are now at the other extreme in oversold territory.
Traders will sometimes use the crossing of the stochastics and signal lines as additional buy/sell signals.
When the blue fast line crosses below the slower red signal line, that is known as a crossover sell signal.
When the fast line crosses above the signal line, that is known as a buy signal.
It is on March 14 that the stochastics crossed above its signal line, giving a buy signal.
So this is when the trader exits the short position with a profit of $96.
We can see the bearish divergence in both Stochastics and RSI:
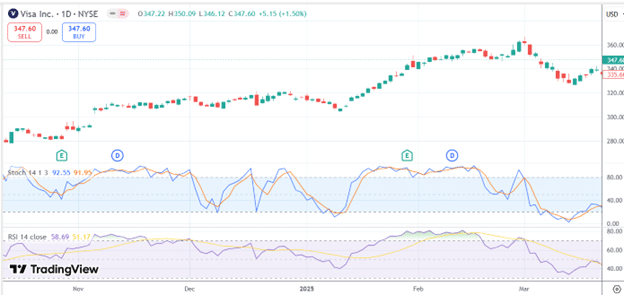
If we look at stochastics versus RSI, we see that stochastics are overbought and oversold more frequently than RSI.
And it makes cleaner moves from one end to the other end.
In this respect, the stochastics can give better signals when trying to time reversals.
Don’t just buy and sell whenever stochastics go into oversold and overbought.
Wait at least until it comes back out of those zones.
And it’s even better if there is divergence.
We hope you enjoyed this article on how to use stochastics to predict reversals.
If you have any questions, send an email or leave a comment below.
Trade safe!
Disclaimer: The information above is for educational purposes only and should not be treated as investment advice. The strategy presented would not be suitable for investors who are not familiar with exchange traded options. Any readers interested in this strategy should do their own research and seek advice from a licensed financial adviser.
