
In a previous article, we had talked about selling cash-secured puts and its various metrics, such as its potential annualized return, break-even price, and so on.
Contents
In this article, we will show you how to use our Cash Secured Put Calculator to calculate those metrics.
You can get your free cash secured put calculator here:
As an example, suppose an investor wants to sell a cash-secured put option on Nvidia (NVDA) with the potential of getting ownership of 100 shares of that stock.
Therefore, the investor sets aside enough cash to buy those 100 shares.
That is what makes the trade “cash-secured”.
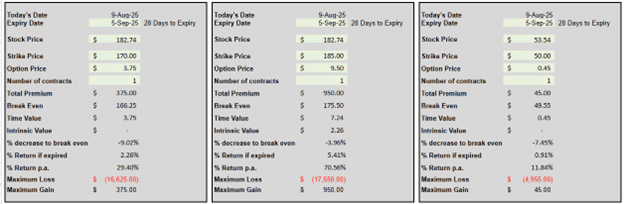
If the investor were to sell the $170 strike put option, that would require $17,000 of reserved dollars.
This is because if the NVDA price is below $170 at expiration, the investor is obligated to purchase the 100 shares at $170 per share.
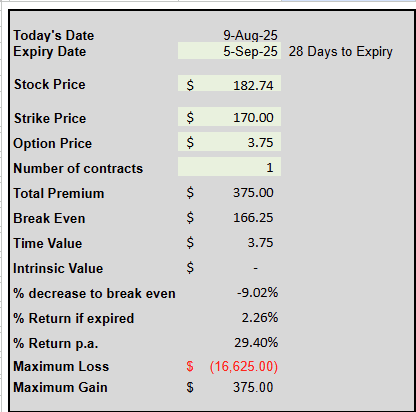
NVDA is currently trading at $182.74 per share.
Most investors will sell an option with a strike price that is lower than the current stock price.
This is known as an out-of-the-money put option.
If NVDA does not drop below $170 at expiration, the investor would keep the premium that was received for selling the put option.
We say that the option expired worthless.
For this example, suppose the investor sells the $170 put option that expires on September 5th, 2025.
This option’s market value at the time is $3.75 quoted on a per share basis.
That means that the investor received $375 for selling one option contract, since one contract represents 100 shares.
We now have all the information to put into the green cells of the spreadsheet calculator:
You only need to enter numbers into the green cells.
You don’t need to touch the other cells.
It already knows today’s date and calculates that the trade still has 28 days till expiration.
The stock price and the option price should be entered on a per-share basis.
You also need to enter the strike price and expiration of the option being sold, and the number of contracts being sold.
The calculator calculates the rest of the information.
This is the dollars received for selling the put contracts.
It depends on the value of the put option and the number of contracts you have sold.
Total premium = value of the contract on a per share basis x 100 x number of contracts
How far can the stock price drop, and the trade still be profitable?
This is the break-even price.
If we look at the P&L (profit and loss) graph at expiration:
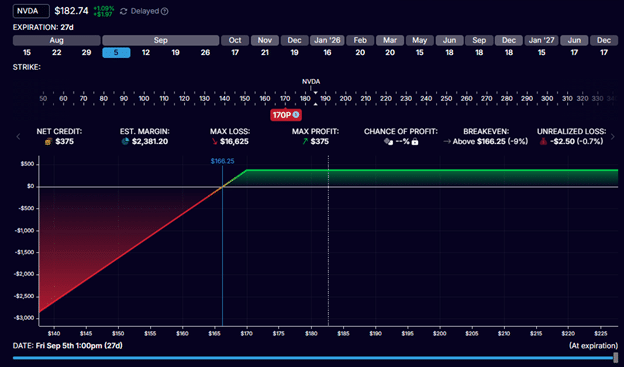
NVDA can be anywhere above $166.25 per share at expiration, and the investor would make at least a penny or more on the trade.
If NVDA is below $166.25, the investor would lose money on the trade.
$166.25 is the break-even price.
How is this calculated?
If you double-click on the cell for break-even price:
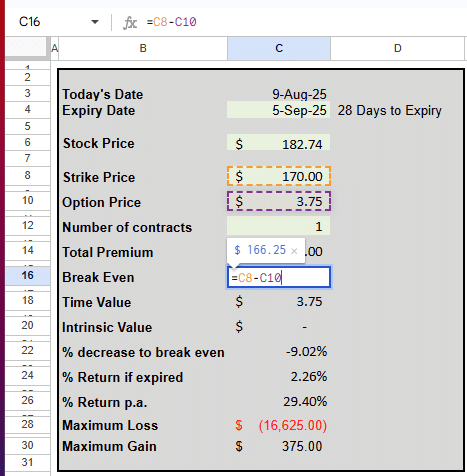
You can see the formula being used.
The value in cell C10 on the spreadsheet is being subtracted from the value in cell C8.
It is the strike price minus the option price.
In our example:
Break even price = $170 – $3.75 = $166.25
If NVDA drops to $170, our profits begin to drop.
But NVDA can drop even further before we lose money because we had gotten a credit based on the option price that we sold the option for.
This is the percentage drop that the stock price can experience and still be profitable in the trade.
In this case, NVDA can drop from $182.74 to $166.25 and still break even. It can drop 9%.
% to break even = ($166.25 – $182.74) / $182.75 = -9%
This tells us the value of the time the investor sold.
Another term of time value is “extrinsic value”.
Option sellers make money by selling extrinsic value.
The more time till expiration, the more extrinsic value.
Hence the term “time value”.
Because the investor’s put option is out-of-the-money with a strike price below the current price of the stock, the entire option value is time value.
The trade currently has a time value of $3.75 per share.
An option’s value consists of both intrinsic and extrinsic value.
Since the entirety of this option value is extrinsic value, there is no intrinsic value for this option.
But that can change as the price of NVDA moves in the money.
You can update the green cells on a daily basis to see the values recalculate.
The max gain from this trade is the credit initially received, which is $375.
This is true regardless of how high the NVDA stock price may go (because the investor does not own the stock).
The investor only sold the put option to capture its premium.
This max gain is achieved if the put option expires worthless without the stock being assigned.
In other words, if NVDA is at least above $170 at expiration.
The worst-case scenario (however unlikely) is for the NVDA stock price to go to zero, and the investor is assigned 100 shares (buying at $170 per share).
That would be like losing $17,000 on the 100 shares of stock, but compensated by the $375 credit initially received.
Hence, the max loss in our example is:
Max loss = $17,000 – $375 = $16,625
This is the percentage return on the trade if the put option expires worthless without the stock being assigned.
In that case, the investor keeps the $375 initial credit.
The return of $375 out of a maximum capital at risk of $16,625 is a 2.26% return.
This trade only tied up capital for 28 days.
If we were to extrapolate this kind of return for a whole year (365 days), it would be
2.26% x 365 / 28 = 29.4% per year.
With three calculator panels available, an investor can run the numbers to see different scenarios of selling different put options with different strike prices and expirations.
The second panel shows a more aggressive trade by selling an in-the-money put option at the strike price of $185:
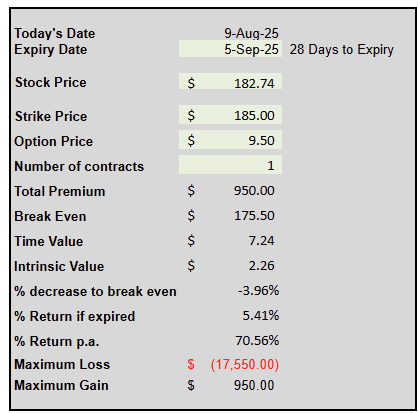
Since NVDA is trading at $182.74, there is $2.26 of intrinsic value in this option:
$185 – $182.74 = $2.26
This trade has a higher return of 5.41% if the option expires worthless.
But since the percentage decrease to break even is smaller at -3.96%, it is more likely to be assigned than in the first example.
And it has a higher max potential loss.
If $17,550 is too much capital you want to have put on reserve, the third panel compares a short put sale on GM stock, which is priced at only $53.54 per share:
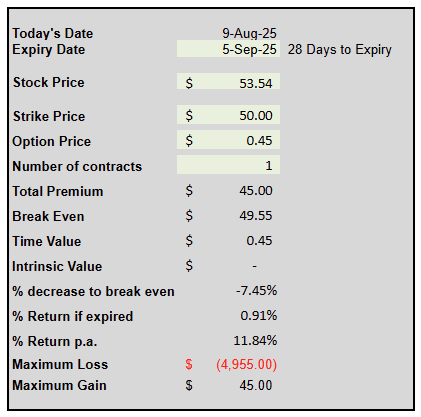
Its max loss is less than $5000.
It is a less aggressive trade. But doing similar trades throughout the whole year can result in a potential annual return of $11.84%.
Learn Options the Right Way — Step by Step
Cash-secured puts represent just one of many sophisticated options strategies that can enhance your trading arsenal.
If you’re interested in learning a systematic approach to options trading:
- Options Income Mastery: Learn proven option strategies with proper risk management techniques ($397). 1-month program.
- The Accelerator Program: 12-month program covering 9 major strategies with comprehensive portfolio management for serious options traders ($1,497).
Both programs include detailed modules on managing assignment scenarios, technical analysis, trading psychology, and proper position sizing techniques.
The cash-secured put calculator helps you quickly get these numbers to decide on which put sale to make.
We hope you enjoyed this article on how to use the cash secured put calculator.
If you have any questions, send an email or leave a comment below.
Trade safe!
Disclaimer: The information above is for educational purposes only and should not be treated as investment advice. The strategy presented would not be suitable for investors who are not familiar with exchange traded options. Any readers interested in this strategy should do their own research and seek advice from a licensed financial adviser.
