
Today, we will look at a completely risk-free options collar trade.
Risk-free collars are not synonymous with zero-cost collars.
The zero-cost collar just means that you can add an options collar around a stock for zero additional cost.
Those are common, but they are not risk-free.
The options collar we are discussing is less common, and the entire trade has no risk of loss.
Contents
A collar is when an investor owns 100 shares of stock.
The investor then buys a put option to protect that stock and sells a call option to take in a credit to pay for that put option.
If the credit exceeds the cost of the put option, then we have a zero-cost collar.
If the credit exceeds the cost of the put option by so much that it covers any losses from a declining stock price, then you have a risk-free trade.
On January 23, 2025, an investor buys 100 Nike (NKE) shares for $73.16 per share.
He promptly buys a put option with a strike price of $72.50, expiring on December 19, 2025.
This costs $710.
With commissions and fees, let’s say it costs $710.65.
He promptly sells a call option with a strike price of $75, expiring on December 19, 2025.
This gives him a credit of $839.33 (with commissions and fees taken out).
We see this is already a zero-cost collar because the sale of the call gave him more money than it costs for the put option.
In fact, he nets a credit of $128.68.
This credit can compensate him for any potential loss in the stock price.
The put option entitles the investor to sell 100 shares of Nike at $72.50 (provided it is before the option’s expiration date).
The most that the investor can lose from the stock then is $0.66 per share because
$73.16 – $72.50 = $0.66
For 100 shares, the most the investor can lose from a declining stock is $66.
But if that were to happen, the $128.68 credit more than compensates for this loss of $66.
Therefore, this investment should not lose money – unless the investor makes a trading error.
In fact, this trade should make at least $62 no matter what happens to the Nike stock price.
If we were to input those prices into OptionStrat modeling software, we would see that the risk graph would always be above the zero profit line.
The profit of the trade is shown on the vertical axis.
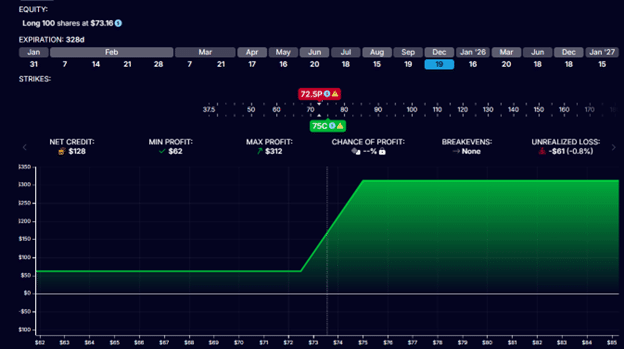
It calculates the minimum profit to be $62 and the maximum profit potential to be $312.
If Nike is above $75 per share at expiration, the put option will expire worthless.
The stock will be called away at $75.
With 100 shares, the investor would receive $7500 at expiration to sell the 100 shares at $75 per share.
Therefore, the net profit in that case would be
Purchase of 100 shares: -$7316
Purchase of put option: -$710.65
Sale of call option: $839.33
Sale of 100 shares: $7500
Net profit: $312
Those who are observant will note that the expiry of the call and put options are 300 days out in time.
That means it can take 300 days to make that $312 profit.
Annualized to a year that has 365 days, that would be equivalent to a profit of $379.60 in a year.
Since this trade requires the purchase of 100 shares, it ties up roughly, on average, $7316 of capital.
In percentage terms, this comes out to be a 5.2% return on capital per year.
$379.60 / $7316 = 5.2%
The general risk-free rate of return as of January 2025 is 4.2% based on the three-month U.S. Treasury Bill yield.
Therefore, our Nike risk-free collar makes about 1% more than the risk-free rate of return.
Yes, it can.
And it can be filled at such prices.
The slight misalignment of prices in far-expiry options and some random movement of the stock price can enable such prices to be realized.
These same price anomalies can cause an uninformed trader to exit such risk-free trade at a loss.
Zero-risk is guaranteed at the time of expiration of the options.
Before expiration, the trade can experience P&L that are negative.
If a trader were to exit at an inopportune time when the P&L happens to be negative, then the trade is not risk-free.
The risk would be the risk of human error.
By knowing that $312 is the max profit of the trade, the investor may have the opportunity to exit the trade in a much shorter amount of time if he happens to see the P&L being near the max profit due to price swings and/or options price fluctuations.
This may enable the investor to get a slightly better-annualized return and recycle the capital earlier.
Tying up capital for most of the year also represents an opportunity cost as this money can not be used elsewhere where the returns might be greater.
Sometimes the market can give us a free lunch.
That free lunch may just be just a bit of butter on un-toasted white bread because it is barely above the risk-free rate of return.
But a free lunch is still better than no lunch.
In our next article, we will show how to look for risk-free trades in case anybody wants to make these their bread-and-butter trades.
We hope you enjoyed this article on how much you can make from a risk-free options collar trade.
If you have any questions, please send an email or leave a comment below.
Trade safe!
Disclaimer: The information above is for educational purposes only and should not be treated as investment advice. The strategy presented would not be suitable for investors who are not familiar with exchange traded options. Any readers interested in this strategy should do their own research and seek advice from a licensed financial adviser.
