
Joe Rabil spent 30 years consulting with institutional investors, specializing in technical analysis using a multi-timeframe system that incorporates trend and momentum analysis.
He explains his system in his online courses and in his book, Invest Like a Pro, which we will review and summarize today.
While it may be possible to get the book from his website at rabilstockresearch.com at a lower debit risk (meaning lower cost), it is nevertheless interesting to read some customer reviews of the book on Amazon.
Contents
When evaluating a product based on online customer reviews, it is essential to determine the authenticity of each review and mentally filter out those that are not relevant.
We might even get a good laugh from such comments as this one:
“It’s not easy to fit in my hand and read whatsoever. It’s kind of annoying me.”
The majority of the reviewers gave the book 5-stars, and the more thoughtful reviewers wrote comments such as:
“5+ Years Learning to Trade and This is the Best Technical Strategy Book I’ve Read”
And:
“Essential for technical analysis”
And:
“Best technical analysis book in my library and turned my trading from a negative four-year history to a winning year last year.”
For traders just starting out, some might be surprised by comments such as:
“5+ years learning to trade” and “negative four-year history.”
Really?
Does it take years to learn to trade profitably?
For some, it can actually take that long – especially if they are learning through trial and error and without a system.
The book Invest Like a Pro presents a system.
Of course, you need to see if this system suits your trading style.
Regardless, trading is no easy task.
Joe Rabil explains why in the chapter titled “Why Trading is So Difficult – The Math.”
In technical analysis, price is king – followed by volume.
Joe says:
“start with price bars, then add MA lines, followed by using the MACD or ADX or both.”
His system utilizes the 18-day simple moving average and the 40-day simple moving average as a buddy system.
Why 18?
We can surmise that this may be influenced by the work of Scot Lowry’s book The Magic of Moving Averages, which Joe specifically mentioned in his book.
We have reviewed Scot Lowry’s book as well.
Joe is quick to point out that you can use the 20-period moving average, or the 21, or even the exponential moving averages if you like.
It is not an exact science.
But whichever you choose, stick to it so that the patterns can become consistent in your subconscious brain.
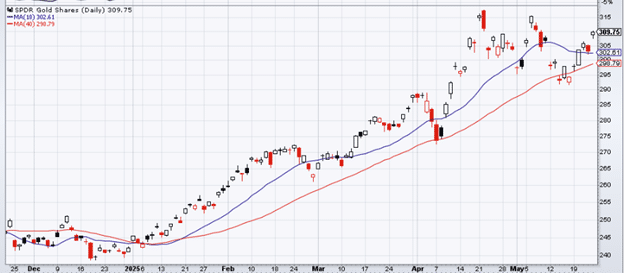
A strong trend is in place, with both moving averages moving at the same rate and in the same direction – almost like parallel lines.
Example of a strong uptrend on a daily chart where the 18MA (blue line) is above the 40MA (red line) and both sloping up:
An example of a strong downtrend on a weekly chart where the 18MA is below and parallel to the 40MA – both sloping down
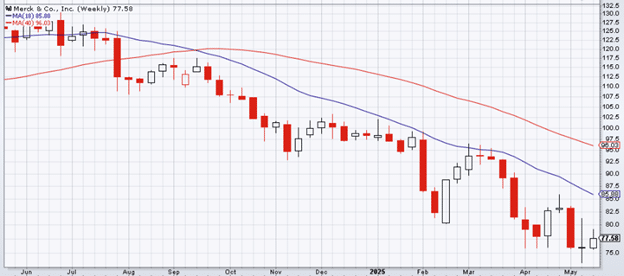
These are not examples from the book but rather examples that we have selected ourselves from more recent charts.
Here is an example of using Moving Averages to determine when an uptrend reverses down:
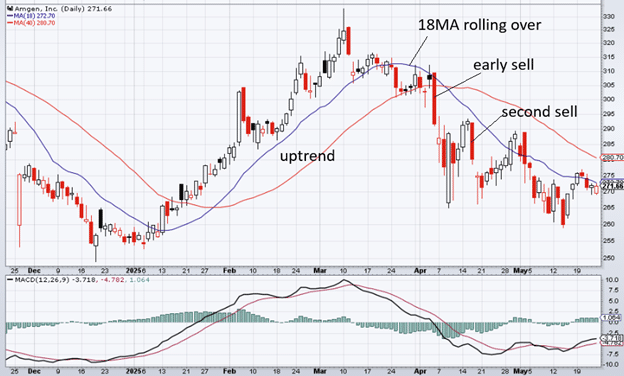
In March, Amgen is in an uptrend when the 18MA is rolling over.
The moving average halted any upward movement in the price.
When the 18MA starts to slope down, and a strong red candle breaks below both moving averages, that could be an early sell opportunity.
Another sell opportunity occurs when the price rallies back up to the 18MA and reverses.
Whether to execute an aggressive sell, a more confirmed entry or refrain from trading altogether depends on other factors, such as a higher timeframe and the current status of the ADX and MACD.
Avoid going against the trend of the higher timeframe.
The four patterns that Joe looks for in the MACD indicator are zero line reversals; pinch plays, momentum divergence, and reverse divergence.
You will see a couple of these patterns in the examples to follow.
While Joe has stuck with the original settings of the MACD indicator, he has adopted a customized setting for the ADX.
He alters the ADX to use 13-period moving averages for the Directional Indicator (DI) lines.
And the 8-period moving averages for the ADX line.
This change is influenced by Charles Schaap and his book called ADXcellence.
When the ADX line is above 25, that means there is a strong trend.
Whether that trend is due to the buyers or the sellers is determined by the +DI and -DI lines.
A strong ADX condition, indicating a strong buying presence, is a favorable condition for stock selection.
Another pattern he looks for is when a stock breaks out of a low ADX condition.
The key to his system is integrating moving averages, MACD, and ADX across multiple timeframes.
The higher timeframe takes precedence over the lower timeframe.
He likes to look for a strong trend with good ADX strength in the higher timeframe, then look for a pullback to this trend.
He uses the lower timeframe as a “trigger timeframe” to determine when the pullback is turning back in the direction of the higher timeframe.
He can see this pullback in the lower timeframe via a counter-trend pattern in the moving averages and then make sure that the ADX strength of the sellers is low.
Below are examples that we found on our own to try to illustrate some of the concepts in the book.
We also encourage readers to look for patterns rather than being handed one.
This trains the eye to find the pattern.
Spotify, on a weekly chart, is showing a strong uptrend with the 18-MA above and parallel to the 40-MA – both sloping up.
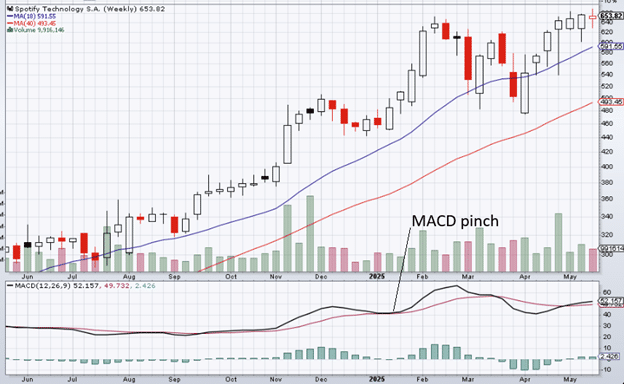
We also have an example of a MACD pinch play where the MACD line (black line) pulls back to its red single line (which preferably is rising).
With the higher timeframe “setup” in place, the goal is to enter into this uptrend by buying a pullback.
At the end of 2024, we see the stock is pulling back towards the 18-week moving average.
This is when we then go to the lower timeframe to look for the “trigger” to better time the entry.
Looking at the daily chart, we see a counter-trend pattern in the moving averages where the 18-MA crossed below the 40-MA (bearish signal) at the start of 2025:
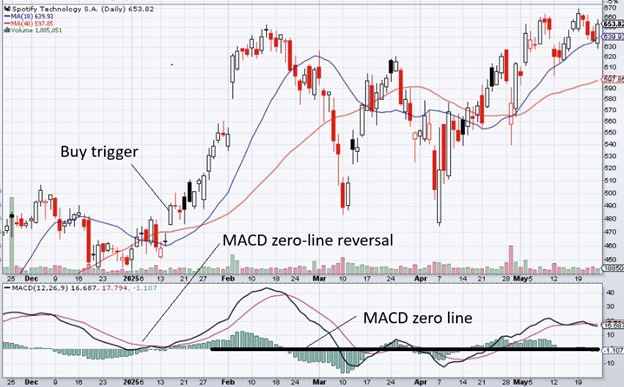
When the price enters the zone created by the two moving averages and then rises above both, this is a bearish signal that fails.
It means that the price is turning up in the direction of the upper timeframe.
We get this trigger to buy on January 15, 2025.
Seeing that a MACD zero-line reversal pattern had just occurred prior to the trigger increases our confidence.
This is when the MACD (black line) is going down towards the MACD horizontal zero line.
When it gets there, it reverses up without crossing the horizontal zero line.
This example also illustrates the reversal pattern that Joe uses to determine a trend reversal.
We have turned on the ZigZag tool (which Joe likes to use when teaching) on the daily chart.
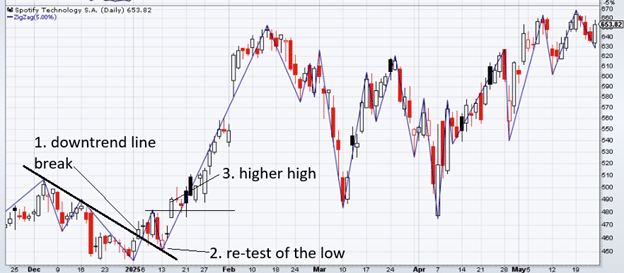
The 3-step reversal occurs when:
- Break of trend
- Re-test of trend
- Confirm the trend changes when the stock makes a higher high.
On the daily chart, Pepsico (PEP) is showing a strong downtrend in the moving averages.
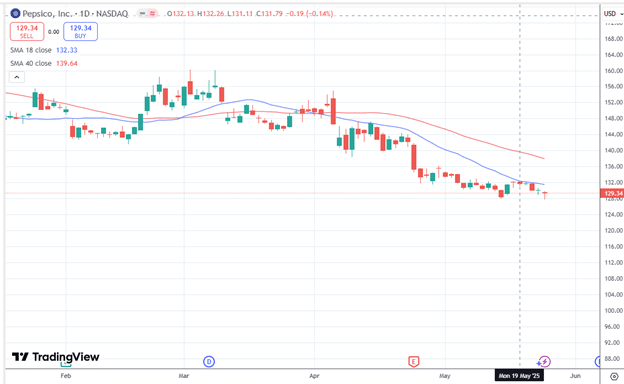
Source: tradingview.com
It rallied back up to the 18-month moving average (MA) on May 19, 2025.
We start looking for a sell signal in the lower-timeframe hourly chart:
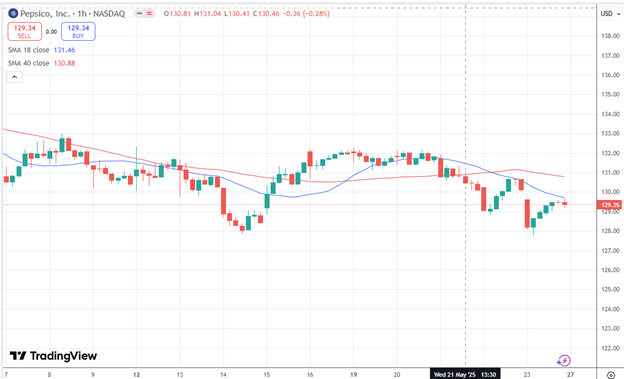
We got the sell signal after the New York lunch hour on May 21.
The 18-MA had crossed above the 40MA, which normally should be bullish.
But the bulls failed on that post-lunch candle when the price broke below both moving averages.
So that is our sell signal.
Joe’s system works in any timeframe.
However, the higher timeframe should be about 5 to 6 times longer than the lower timeframe.
In our last example, we used daily and hourly data.
There are about 6 hours in the trading day.
In our previous example, we used weekly and daily.
There are five daily candles in one weekly candle.
You can also use monthly/weekly charts – roughly 5 weeks in a month.
When reviewing hundreds of charts, he prefers to have the monthly, weekly, daily, and other weekly charts displayed in a four-chart grid.
In the book Invest Like a Pro, Joe Rabil presents a system that he has developed, drawing influences from the technical analysts already mentioned, as well as a few others, including W.D. Gann, Victor Sperandeo, Linda Raschke, Dave Landry, Kevin Haggerty, and Stan Weinstein.
If you only scrolled through the lengthy article and wanted a quick summary of his system, you can watch Joe Rabil’s video, which shows the backtest result of his simplified strategy.
Note that this is a simplified version, which only utilizes the moving averages in two timeframes; it is not the full strategy, which incorporates the added sophistication of ADX and MACD, as explained in the book.
We hope you enjoyed this article reviewing the book Investing Like a Pro.
If you have any questions, send an email or leave a comment below.
Trade safe!
Disclaimer: The information above is for educational purposes only and should not be treated as investment advice. The strategy presented would not be suitable for investors who are not familiar with exchange traded options. Any readers interested in this strategy should do their own research and seek advice from a licensed financial adviser.
