
Day-trading and 0-DTE trading can become emotional, as quick decisions must be made in the heat of the moment.
At some level, we know that we cannot trade on emotions, but rather need to trade on probabilities and data.
Traders often trade on emotion and guesswork because they lack the necessary probabilities and data to inform their decisions.
This is where Edgeful.com comes in.
The live probabilities and data are at your fingertips in the form of their “reports”.
The word ‘report’ is somewhat misleading because it is not a static output; rather, it is a dynamic document.
The probabilities change with time.
The Edgeful report is dynamic, and it is much more than that.
Contents
To give you a better idea of what we mean, let’s take the gap fill strategy.
Here, “gap” is defined as an overnight gap.
A gap up simply means that the open today is higher than the previous day’s close.
A gap down is when the open is below yesterday’s close.
This is not a gap in the candles; that would be the “outside days” report instead.
When a trader sees a gap up from the previous day’s close and expects the price to fill that gap, that trader might go short because he has heard (from the Internet) that gaps predominantly tend to fill.
But is this really true? Let’s see some hard, real data.
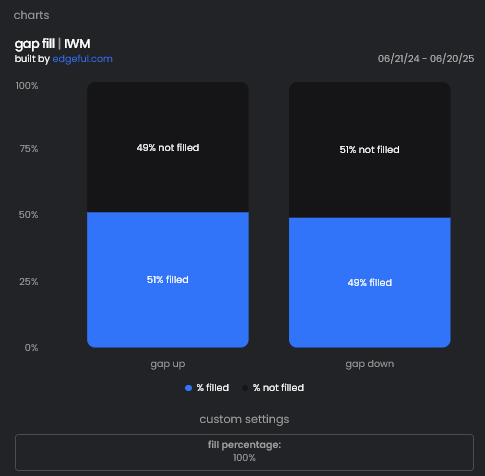
This report is a dynamically generated report from real data of ticker IWM (Russell 2000 ETF) from the past twelve months from June 21, 2024, to June 20, 2025.
The gap filled only 51% of the time when the opening price gapped up.
And upon gap down, it filled even less at 49% of the time.
Is there an edge here?
Not really.
Looks more like a coin toss. It’s no wonder that a trader using this rudimentary gap-fill strategy is not making any money.
This is not to say that the gap fill strategy does not work.
It does work for traders who have the right data.
Now look at this report on a different ticker, SPY (S&P 500 ETF), on a more recent timeframe of the past three months from March 21, 2025, to June 20, 2025:
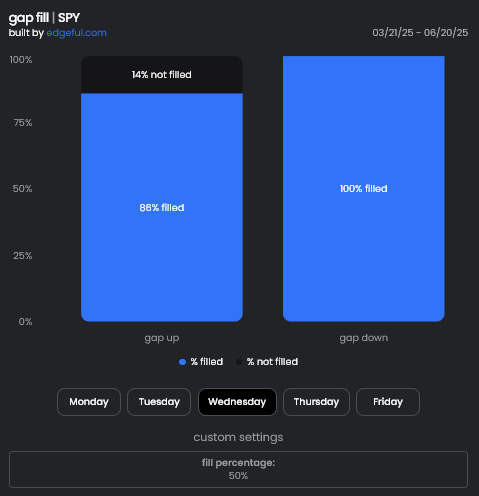
We have customized the “fill percentage” to be 50% fill of the gap (half-gap).
And we are only showing the statistics for Wednesday (middle of the week).
The report says that the gap up is likely to be half-filled 86% of the time if there is an overnight gap up.
Of the period sampled, the gap down on SPY on Wednesdays filled halfway 100% of the time.
Now that is a more favorable probability for a trader to trade on.
Now, a trader might think to take profits when the gap is filled halfway instead of waiting for the gap to fill all the way.
They can adjust the settings to examine the stats for 75% fill, 66% fill, and so on.
Alternatively, if they are a scalper, they may be interested in seeing how often the gap is filled to 10%.
They can find the statistics that fit their trading style.
This is how Edgeful identifies market edges.
This example was not to show that SPY is a better asset to perform the gap fill strategy on than IWM.
We had arbitrarily picked these tickers.
This example demonstrates that blanket statements like “gaps always fill” are misleading.
The probability of filling gaps depends on market conditions at the time, the asset, the day of the week, the size of the gap, whether it is a gap-up or gap-down, and the expected fill percentage.
How are you going to know these probabilities without Edgeful?
And these probabilities change with time.
Edges in the market wax and wane.
They come and go depending on market conditions.
That is why running these reports regularly is important to determine if the strategy we are using still has an edge.
One might think that a report querying five years’ worth of data would be more meaningful than one covering a three-month time period.
Sometimes it is, but not always.
A strategy might have had an edge 5 years ago, but not at the current moment.
Or vice versa.
This is why Edgeful lets you query anywhere from 1 month to 5 years.
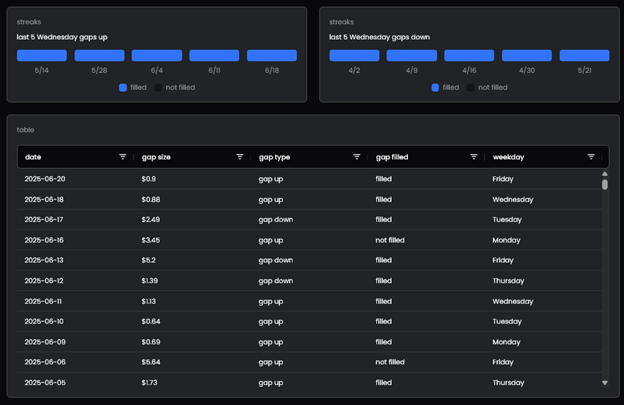
The above report showed that (during the three months queried) when SPY gaps down on Wednesday’s open, it will always (100%) fill the gap at least halfway.
Whenever we see 100%, we should question it because nothing in the market is perfect.
So let’s look at the actual data that generated that histogram:
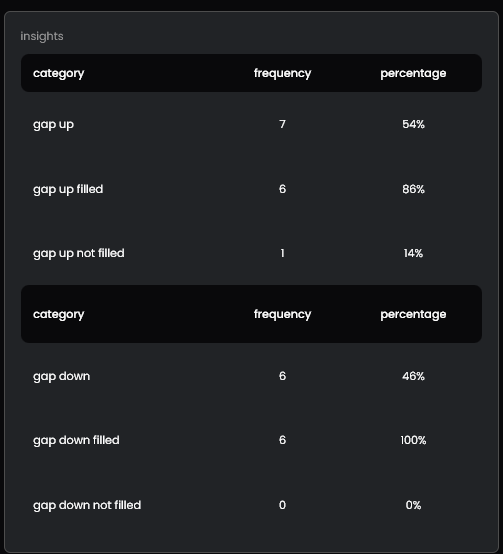
Okay, so the sample size might be small because there are only thirteen Wednesdays in three months.
If that is too few occurrences to trade on, we can click on Monday, Tuesday, Thursday, and Friday to see if the stats are good enough to trade on those days as well.
We can also look at the actual table data:
To increase our sample size, we can look over occurrences up to a maximum of five years:
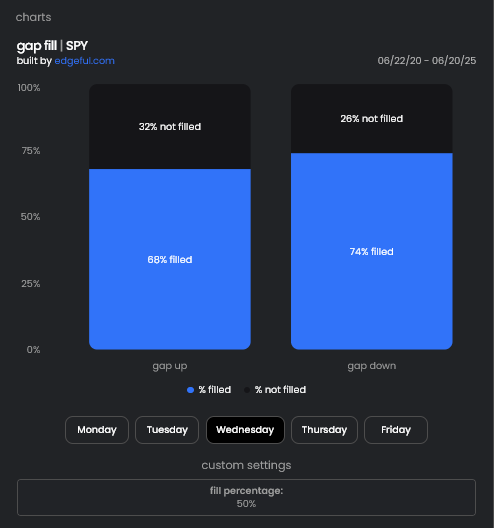
Now, with a larger sample size, we see that it is no longer 100%.
But the edge is still there with 68% and 74% chances of filling the half-gap.
The asset classes for which the reports are available include stocks, forex, crypto, and futures:
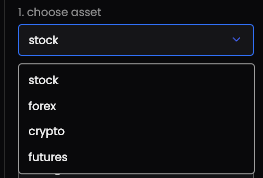
Including futures as an asset class in the report is important for traders trying to pass prop firm funding challenges, as many involve day-trading futures.
The gap fill report is just one of many.
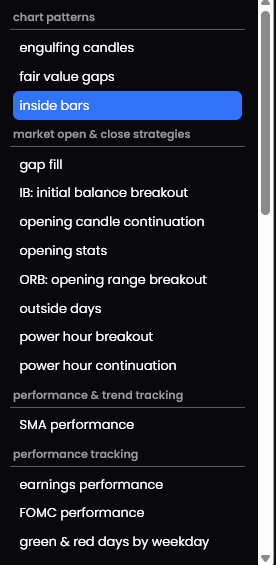
For the day trader, they may have heard of the opening range breakout (ORB) and the initial balance breakout strategies.
For the scalper, they may also be interested in the Average Consecutive Bars report or the ADR (Average Daily Range) report.
Indeed, this analytical software is mostly geared toward day traders.
There are some reports suitable for swing traders.
The “previous week range” and the “SMA performance reports” are for a bit longer-term strategies.
Select the strategies (the reports) that you like to play in the “What’s in Play” section.
Edgeful will provide you with a summary of the report, so you know if the strategy is still in effect for today or not.
For example, if the overnight gap has already been filled, it will show “filled,” indicating that you will not have the opportunity to play this strategy today.
Look for other setups, such as the “inside bars” or the “opening candle continuation,” for example.
The concept of the screener is similar to that of “What’s in Play”.
Except that it shows for multiple tickers and assets, whereas the “What’s in Play” feature shows the status of the reports for the one symbol you are trading.
The screener can also give you a sense of what type of market day today is likely to be.
If you see all your tickers showing bullish bias, then you think that today might be a bullish trend day.
If you see an even mix of bearish and bullish bias strategies setting up, then you might think “chop day”
As of mid-2025, Edgeful is still relatively new and continues to actively update and expand its platform. A newer feature being added is Edgeful Algos.
Using Edgeful strategies (gap fill, ORB, and initial balance), the algorithms will inform you when to enter, when to exit, and when to stop out via TradingView alerts.
During the signup process, you will be asked some questions about yourself so that they can personalize the user interface for your level of expertise.
They wanted to make sure that people don’t mistake the questions as “an annoying quiz”.
At the end of the signup process, it allows you to enter your TradingView username so that you can get custom indicators to run on your TradingView charts.
Edgeful and TradingView are not linked.
The TradingView indicators are “invite-only” indicators that you can access in your TradingView account and turn on or off to visualize various strategies.
For example, there is an indicator to outline the New York versus Tokyo futures sessions for you.
Or another indicator to highlight the “initial balance” on your chart.
There is also a Discord community that hosts weekly webinars.
After the signup, immediately watch all the videos in the five chapters:
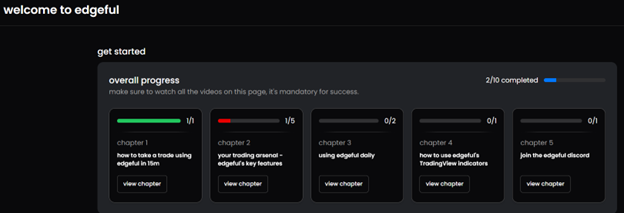
As they say, it is mandatory for success.
If you think you already know how to use Edgeful by watching its public YouTube channel, watch it anyway for additional insights.
These videos are unlisted and are made by Andre, the CEO of Edgeful.
Andre has a background in finance and accounting, having worked as an analyst at Goldman Sachs and a hedge fund.
Edgeful provides you with the probabilities and data to put the edge on your side.
We don’t have time here to discuss all the statistics and reports that Edgeful provides.
However, look forward to a future article on how options traders can utilize Edgeful.
We hope you enjoyed this article on Edgeful.
If you have any questions, send an email or leave a comment below.
Trade safe!
Disclaimer: The information above is for educational purposes only and should not be treated as investment advice. The strategy presented would not be suitable for investors who are not familiar with exchange traded options. Any readers interested in this strategy should do their own research and seek advice from a licensed financial adviser.
