
Beta-weighted delta (or beta-adjusted delta) is a normalized delta that is comparable across different assets when measuring directional exposure.
It is also sometimes referred to as “portfolio delta” because that is its primary use: helping an investor understand how much the portfolio’s profit and loss (P&L) will change in relation to movements in the index.
So that is the short answer.
To provide a detailed explanation and outline the calculation (if your trading platform does not do this for you), we will first need to understand what delta and beta are.
Contents
If an investor were to buy one share of Adobe (ADBE) at the market price of $408 per share, the Tastytrade platform would show that position to have 1.0 delta…
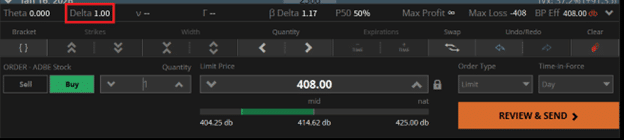
If the investor were to buy 100 shares of ADBE, that Delta number would change to 100.00.
This is the raw delta, which is the normal delta that options investors discuss.
It has many uses and interpretations.
One way you can think of this delta is the “share equivalence” of a position.
A delta of 1.0 is equivalent to owning one share of the underlying asset.
We observed that buying one share of ADBE results in a 1.0 delta.
And 100 shares of ADBE results in 100.0 delta.
Suppose an investor buys an out-of-the-money (OTM) long call on Costco (COST) with a strike of $1075 expiring in 33 days.
The Tastytrade platform indicates that this position has a positional delta of 22.64, or approximately 23.
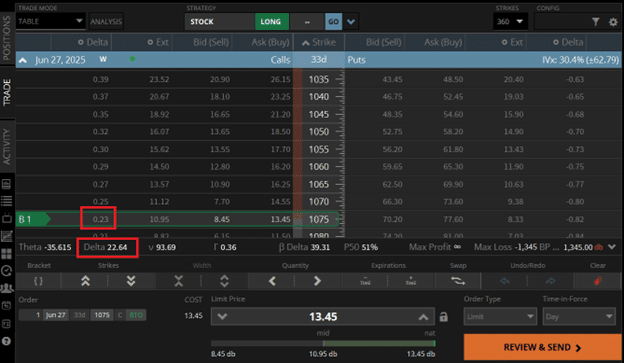
This call option is said to be at the 23-delta on the option chain because we see 0.23 in the delta column on the option chain.
This long call, with a positional delta of 23, has the same directional exposure as another investor buying 23 shares of COST stock.
If we have a bull put credit spread on Nike (NKE):
Date: May 23, 2025
Price: Nike @ $60/share
Sell one June 27 NKE $63 put
Buy one June 27 NKE $58 put
Credit: $272
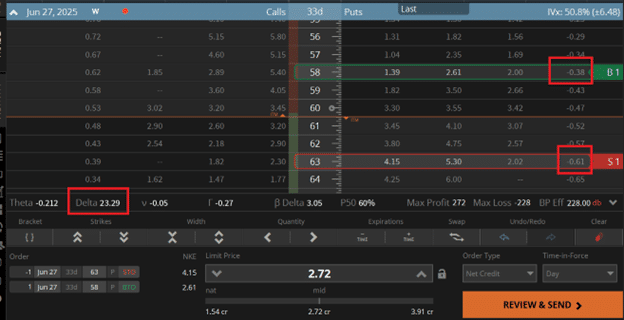
The platform shows that this spread has a delta of 23.29.
This is because the long $58-strike put option has a delta of -0.38
The $63-strike put option has a delta of -0.61.
But since we are selling it, the short $63 put option has a delta of +0.61 (reversed the sign).
The aggregate is a delta of:
(0.61 – 0.38) x 100 = 23.29
Which is what the platform already calculated for us.
Why did we multiply by 100?
It is because the delta value listed in the option chain column is on a “per share” basis.
Since one contract of the put spread represents 100 shares, this per-share delta is 100 times smaller than the position delta.
Regardless, this put spread has a position delta of 23.29.
That means that the directional exposure of this bull put spread is equivalent to owning 23.29 shares of NKE.
In our example, one long call in COST has a positional delta of 23.
And one put spread in NKE also has a positional delta of 23.
Does that mean that our COST position is equivalent in risk and directional exposure as our NKE put spread position?
No!
A 23 delta in COST is not the same as a 23 delta in NKE.
They are not comparable because they have different underlying assets.
It is like comparing apples to oranges.
Because 23 shares of COST is not the same as 23 shares of NKE, the price of COST is $1008/share, while the price of NKE is $60/share.
The COST position has a Delta Dollars of:
23 x $1008 = $23,184
The NKE position has a Delta Dollars of:
23 x $60 = $1,380
The COST position has a notional value of $23,184.
The NKE is a much smaller position, valued at $1,380.
This has nothing to do with the size of the debit or credit received when initiating the trade.
The definition of position delta is that it measures how much the P&L (profit and loss) of the position will change when the price of the underlying asset changes by $1.
Based on this definition, it means that if the COST price per share increases by $1 from $1008 to $1009, then our call spread P&L should increase by $23 (because this position has 23 delta).
If NKE goes up in price from $60 to $61 per share, then the P&L of the NKE bull put spread is expected to increase by $23 (assuming all other factors, such as volatility, etc, remain the same).
Because the size of the underlying is so different, it is more effective to discuss it in terms of percentages.
If COST drops by 1%, the P&L of the long call option is expected to decrease by $230.
If NKE drops by 1%, the P&L of the bull put spread is expected to decrease by $13.80
The COST position represents a bigger risk than the NKE position, even though they both have the same positional delta.
Side note:
The 1% COST drop means the price per share decreases by $10, as 1% of $1008 is $10.
A drop of $10 per share means an expected drop in P&L of $230.
NKE’s drop of 1% means a loss of only $0.60 per share.
If a loss of $1 per share results in a P&L loss of $23, then a loss of $0.60 per share results in a loss of $13.80, as calculated by the following…
$23 x 0.60 / 1.00 = $13.80
In any case, we need not get bogged down by the math.
The point is that positional deltas are not comparable because the underlying assets are different.
Suppose an investor has one long call in COST, one bull put spread in NKE, and one share of ADBE stock.
How is the investor to know which is the riskiest position?
How much directional exposure does the investor have in the market?
If the S&P 500 goes down 5%, how would that affect his portfolio?
How much dollar risk would that be?
These positions are all bullish on the market.
If the investor wants to hedge (or protect) his portfolio, how many contracts of put options on SPY should this investor buy?
This problem can not be solved by looking at the positional delta.
Delta Dollars can approximately solve it.
Here are the delta dollars of the positions as calculated by multiplying the delta with the price per share:
COST position: $23,184
NKE position: $1,380
ADBE position: $408
Portfolio: $24,972
The $520-strike SPY put option, with 67 days until expiration, has a positional delta of -15.37.
To hedge this portfolio, you need 2.8 such put options, which would give a delta dollar of:
-15.37 x $579 x 2.8 = -$24,918
SPY is trading at $579.
Since you can not have 2.8 contracts and most investors would not hedge 100% of the portfolio, they might buy only two put contracts, which would have a delta dollar of:
-15.37 x $579 x 2 = -$17,798.
By adding these two put options into the portfolio, it would reduce the delta dollar exposure down to $7,174, as calculated by:
$24,972 – $17,798 = $7,174
This reduces the overall risk in the portfolio in the event that the market drops.
This calculation assumes that COST, NKE, and ADBE move the same as SPY would move.
They do not all move exactly the same as SPY, which is why this is an approximate solution.
This is where beta comes to the rescue.
It measures a stock’s volatility in relation to the overall market.
COST: beta = 0.76
NKE: beta 1.06
ADBE: beta = 1.3
These are the 5-year beta values from stockcharts.com.
The values may differ slightly if obtained from different platforms or vendors, depending on the benchmark chosen for the overall market, the length of the look-back period, the calculation method, and other factors.
For our purposes, we can think of SPY, the ETF for the S&P 500, as a proxy for the overall market.
So, NKE moves very similar to SPY. A beta of 1 means that the stock is highly correlated to SPY.
If SPY goes up 1%, NKE is likely to go up 1%.
If SPY goes down 2%, NKE is expected to also go down 2%.
Note that this is only statistically expected.
It does not mean that it will.
The future cannot be predicted, and it is possible for NKE to move in any direction it wants.
It can not account for events like earnings, which can cause a stock to move up or down regardless of the market.
COST tends to move less than SPY because its beta value is less than 1.0.
It is less volatile than SPY.
ADBE price (in terms of percentages) will swing up and down more than SPY because its beta value is greater than 1.0.
The beta-weighted delta is a normalized delta that considers both the beta and the size of the stock.
It is typically normalized to the reference benchmark of SPY.
The beta-weighted delta of the position from the Tastytrade platform is:
COST: beta-weighted delta = 39.31
NKE: beta-weighted delta = 3.05
ADBE: beta-weighted delta = 1.17
See if you can find these numbers in the above screenshots.
Again, the beta-weighted delta can vary from platform to platform.
These beta-weight deltas are comparable.
That means that you can compare COST’s beta-weighted delta to NKE’s beta-weighted delta.
We are now comparing apples to apples.
That is the whole point of normalizing the deltas to a reference benchmark.
Looking at the beta-weighted delta, COST has more than ten times the directional exposure as NKE.
ADBE is our smallest position, with the least directional exposure to the market, despite being the most volatile of our underlying assets.
This beta-weighted delta can now be added.
Before, they could not be.
The beta-weighted delta of the entire portfolio is 43.53:
39.31 + 3.05 + 1.17 = 43.53
This means that our three positions are equivalent to owning 43.53 shares of SPY.
Our portfolio exposure has a notional value of:
43.53 x $579 = $25,204
(Recall that SPY is currently trading at $579 per share.)
This is very close to the delta dollars of $24,972 previously calculated.
Recall that delta dollars do not take into account beta.
A beta-weighted delta of 43.53 means that a $1 increase in SPY is expected to result in a P&L change in our portfolio of $43.53.
A 5% drop in the market could result in $1260 worth of damage to the portfolio, as calculated by:
A 5% drop in SPY = 0.05 x $579 = $28.95
P&L change = -$28.95 x 43.53 = -$1,260
Suppose we were to add the two put options as a hedge.
The platform shows that one of those put options would have a beta-weighted delta of -15.37.
So, two of them would give a beta-weighted delta of -30.74.
This reduces the beta-weighted delta of the portfolio to 12.79.
Certainly, the equivalency of owning 12.79 shares of SPY is less risky than owning 43.53 shares.
This would reduce the notional value of the portfolio to:
12.79 x $579 = $7,405
Beta-weighted delta is a method for normalizing disparate assets, enabling the comparison and summation of risk and position size.
This is necessary when we want to understand the total market exposure of a portfolio containing different assets.
Is it possible for an asset to have a negative beta?
Yes, when they are negatively correlated to the benchmark.
For example, VXX and SPY are typically inversely correlated.
When SPY goes up, VXX goes down, and vice versa.
Hence, the beta for VXX is -2.82.
If my platform does not give me a beta-weighted delta, how can it be manually calculated?
Using COST as an example:
(Price of SPY) x (beta-weighted delta) = (beta of COST) x (Price of COST) x (Delta of COST)
Solving for what we want:
Beta-weighted delta = (beta of COST) x (Price of COST) x (Delta of COST) / (Price of SPY)
Where:
Price of COST = $1008
Delta of COST = 23
Beta of COST = 0.76
Price of SPY = $579
Beta-weighted delta for COST = 0.76 x $1008 x 23 / $579 = 30.4
Doing similarly:
Beta-weighted delta for NKE = 1.06 x $60 x 23 / $579 = 2.5
Beta-weighted delta for ADBE = 1.17 x $408 x 1 / $579 = 0.8
Why is the manually calculated beta-weighted delta, not the same as given by the platform?
The beta value differs from platform to platform.
The beta used here is from stockcharts.com, which may be static data.
In contrast, trading platforms may use dynamic beta values or internally licensed data that could be calculated using different regression methods and sample sizes.
Even if you compare the beta value from stockcharts.com with barchart.com and with Yahoo Finance, you will find them to be somewhat different.
Even if you were to know the exact beta of a stock, whether it will move that way or not on a given day is still unpredictable.
Positional delta can also differ slightly from platform to platform.
Sorry, trading is not an exact science.
We hope you enjoyed this article on beta-weighted delta.
If you have any questions, send an email or leave a comment below.
Trade safe!
Disclaimer: The information above is for educational purposes only and should not be treated as investment advice. The strategy presented would not be suitable for investors who are not familiar with exchange traded options. Any readers interested in this strategy should do their own research and seek advice from a licensed financial adviser.
