
Overview
This manual will help you with the instructions on how to use the Hydra Trend Rider Indicator in MetaTrader. This manual will cover everything you need to know about this indicator and how you can incorporate this in your day-to-day trading.
© 2025 Intraquotes.
Latest Version: MT4: 1.6 | MT5: 1.3
Introducing a cutting-edge, non-repainting trend indicator designed for peak performance in dynamic markets across various timeframes. Enjoy seamless compatibility with any symbols and receive timely mobile alerts.
Installation and Setup
Step 1: Download the indicator from the MQL5 marketplace.
Step 2: Open MetaTrader 4, go to File > Open Data Folder > MQL4 > Indicators, and paste the downloaded file here.
Step 3: Restart MT4 and navigate to Navigator > Indicators.
Step 4: Drag and drop Hydra Trend Rider onto your chart.
Indicator Features
Hydra Trend Rider works on all time frames, all symbols (forex, Gold, crypto, indices, etc.) for scalping, day trading, and also swing trading.
🖥️ Multiple Timeframe Dashboard
Conduct comprehensive multiple timeframe analysis from M1 to Monthly charts simultaneously with our dashboard. Higher timeframe signals can confirm long-term trends. Marked [A] in fig. (1)
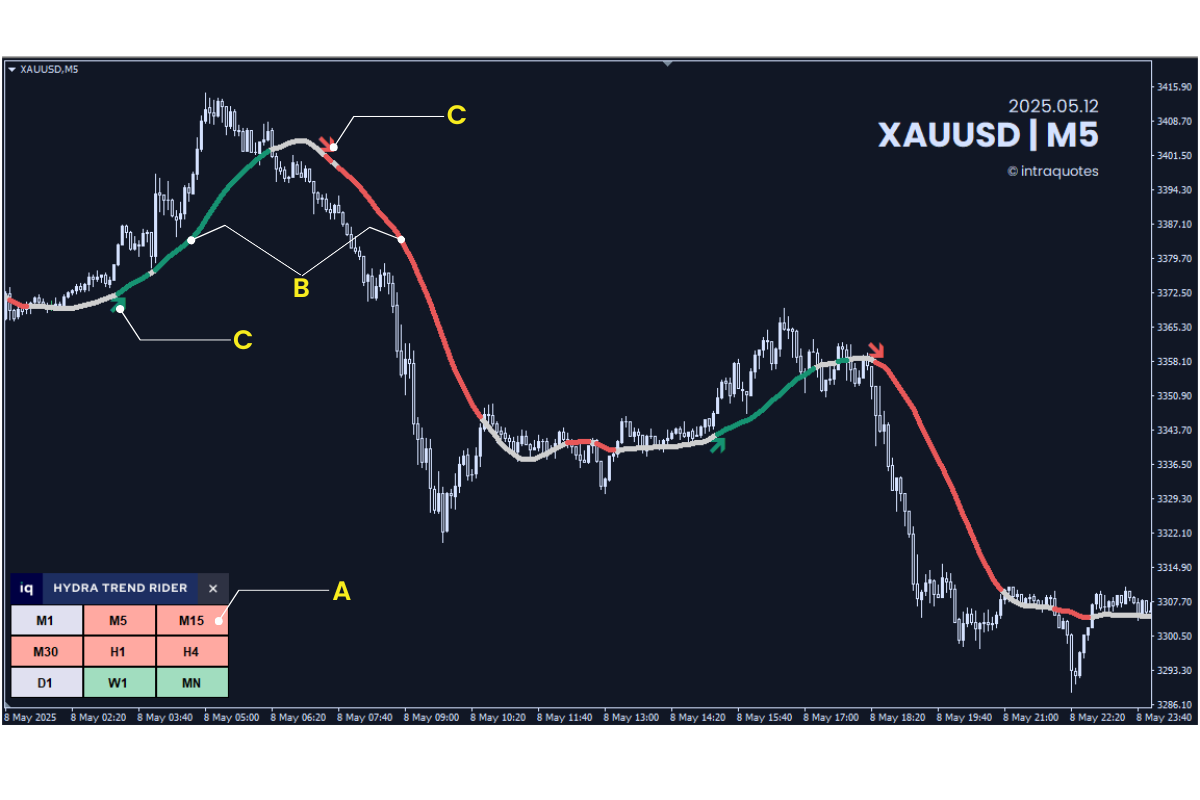
Fig.1: Hydra Trend Rider Indicator on a chart
📈📉 Hydra Line Signal
The indicator gives bullish, bearish, and trend correction signals. Helps to analyze buying and selling trade opportunities with one single line. Line changes its color in different signals which is easy to understand. Marked [B] in Fig (1).
↗️↘️ Hydra Arrow Signal
The buy/sell arrow signals (marked in [C] in Fig 1) from this indicator, make trading easier by automatically highlighting trade opportunities as they appear. These arrows help you spot the best profitable entries with precision, ensuring you enter trades at the right moment. By following these signals, you can trade with more confidence and reduce guesswork in your strategy.
Note: To make the indicator run smooth with optimal performance, it has been designed to show only the recent past 20 arrow signals from the current time.
📳 Mobile Alert
Explore the full potential of this indicator across multiple chart windows in the MetaTrader. Receive alerts for various currency pairs with a hassle-free setup.
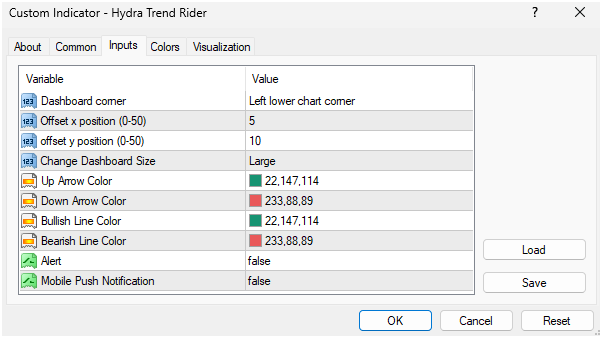
Fig.2: Hydra Trend Rider- Mobile Alert (Indicator Settings)
💻 Indicator Customization Overview
You can customize the indicator dashboard as per your preference. Repositioning option of the dashboard added in the latest version. Now you can reposition the dashboard to any of the 4 corners of the chart with ultra precision of X & Y axis from the indicator settings directly. The indicator has 2 size options, default (standard) & large. You can change the Hydra signal line colors and even enable mobile alert. Refer the above image for the details of Indicator settings input area.
Indicator – How Tos
❓How to open Hydra Trend Rider Settings?
➡️ Right-click on the chart.
➡️ Click on the Indicator List option.
➡️ Double-click on the Hydra Trend Rider Option under ‘Main chart’ or click on ‘Edit’ option to open the Custom Indicator settings window.
❓How to Enable Hydra Alert and Mobile Push Notification?
➡️ Open Indicator Settings, go to ‘Inputs’ Tab.
➡️ Double-click on ‘false’ (default) to open the drop-down list.
➡️ Select ‘true’ from the drop-down list for both the options individually to enable the option.
💡Tip: Enabling Alert system can reduce your screen-time.
❓How to Change Hydra Line & Hydra Arrow Color?
➡️ Open Indicator Settings, go to ‘Inputs’ Tab.
➡️ Change Hydra line colors by double-clicking on the color codes of ‘Bullish Line Color’ and ‘Bearish Line Color’.
❓How to Change Indicator Dashboard Size?
➡️ Open Indicator Settings, go to ‘Inputs’ Tab.
➡️ Double-click the ‘Default’ option to open the drop-down list.
➡️ Select ‘Large’ from the drop-down list.
Indicator Signal
Seamlessly blending trend-following and trend-reversal strategies for unparalleled versatility.
Hydra Default Line Color Definition
Red: Indicates a Bearish Signal
Green: Signals a Bullish Market.
Gray: Suggests a No Entry Zone / Correction Area.
Note: These colors are customizable as mentioned earlier.

In an uptrend or downtrend, the market often corrects itself near the hydra line, which serves as a support or resistance level. The further the candlesticks or bars form from the hydra trend line, the stronger the momentum the trend possesses. During a range market, the arrow signal may appear a few times, but it is advised to avoid trading during those times. Strategy to analyze range market with hydra to avoid losses is explained later in details, keep reading!
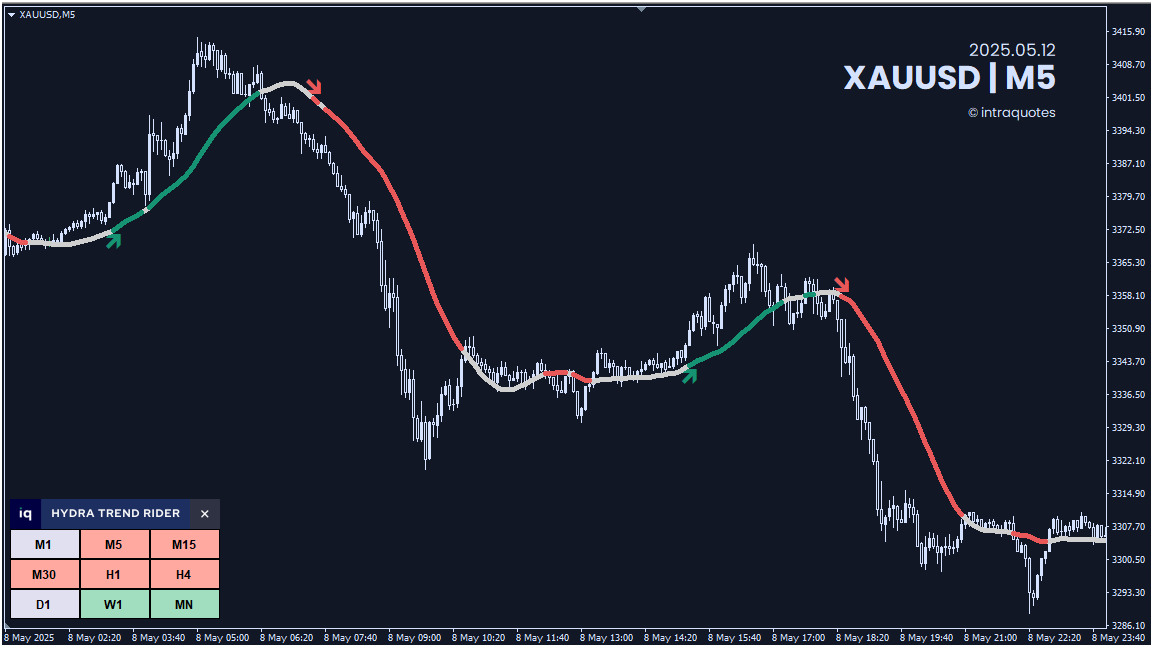
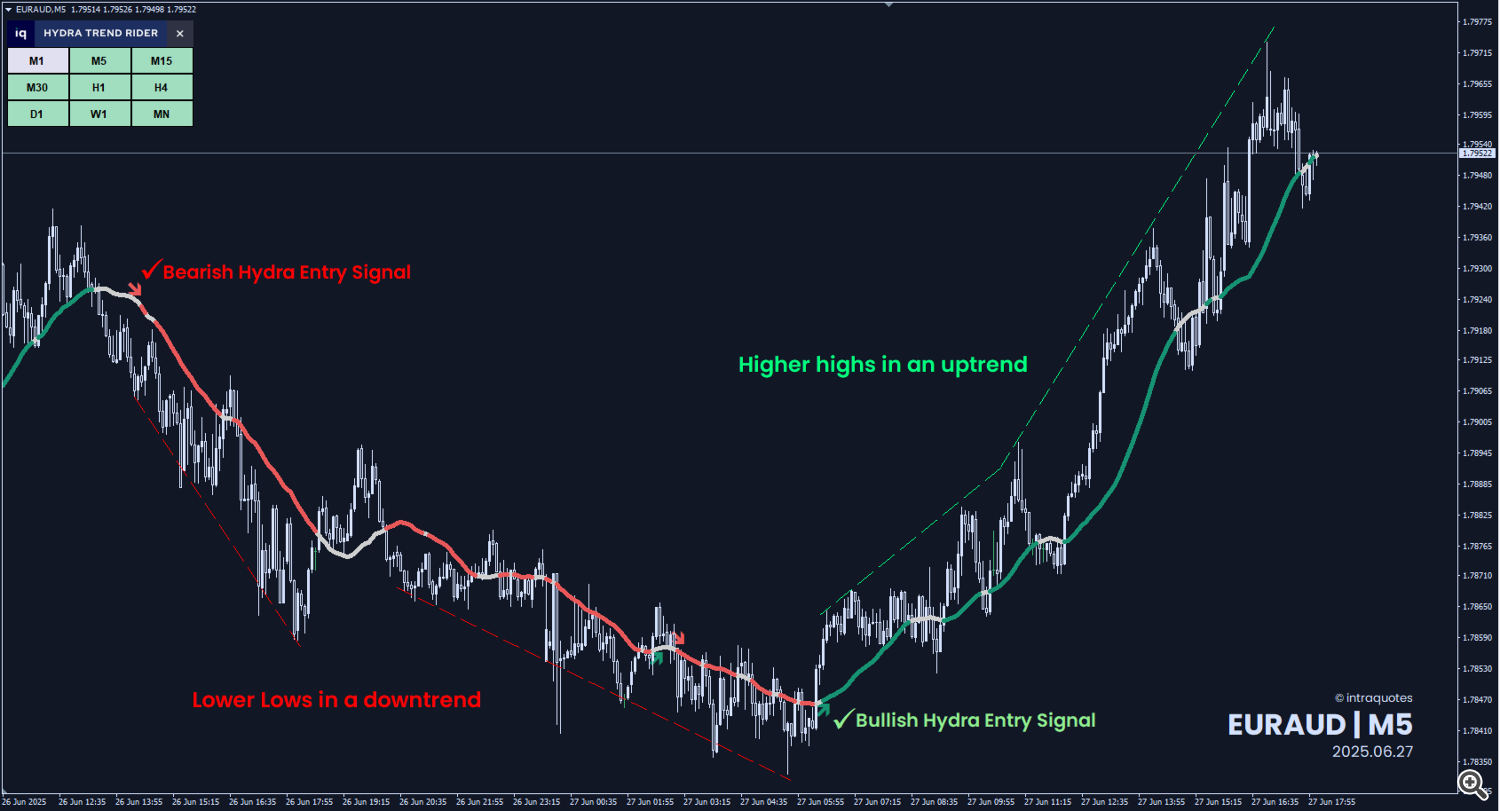
Fig.3: Hydra Trend Rider in action.
What makes it so Special?
Multiple Timeframe Analysis Through:
- Comprehensive Dashboard: Displays short-term (M1, M5, M15), mid-term (M30, H1, H4), and long-term (D1, W, MN) trend signals for a holistic market view.
- Advanced Algorithm: Hydra’s sophisticated algorithm delivers automatic trend signal and arrow signal calculations across three distinct time zones.
- User-Friendly Interface: Effortlessly interpret market trends with color-coded signals indicating bullish or bearish directions.
- Real-Time Trend Analysis: A bearish short-term signal on the GBPUSD 15-minute chart can be seen. The dashboard displays timeframe M1 to H1 all bearish(red) accompanied by a red Hydra line and a red sell entry arrow, suggesting a robust market trend, enabling traders to anticipate movements with greater accuracy.
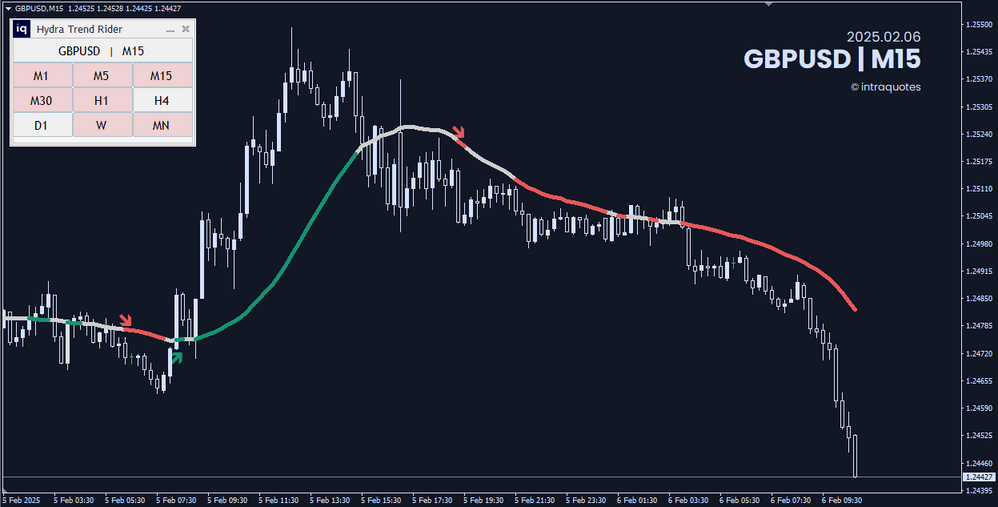
Fig.4: GBPUSD trend signal by the Hydra Trend Rider
Hydra Trend Rider Strategy
Real-Time Range Analysis Strategy 1:
Similarly, in the below picture of EURGBP, the absence of dashboard signals in the M5, and a gray hydra line hints at a potential correction, offering traders a strategic advantage. With Hydra Trend Signals, you’re not just following trends; you’re anticipating them, giving you the power to trade with precision and confidence.
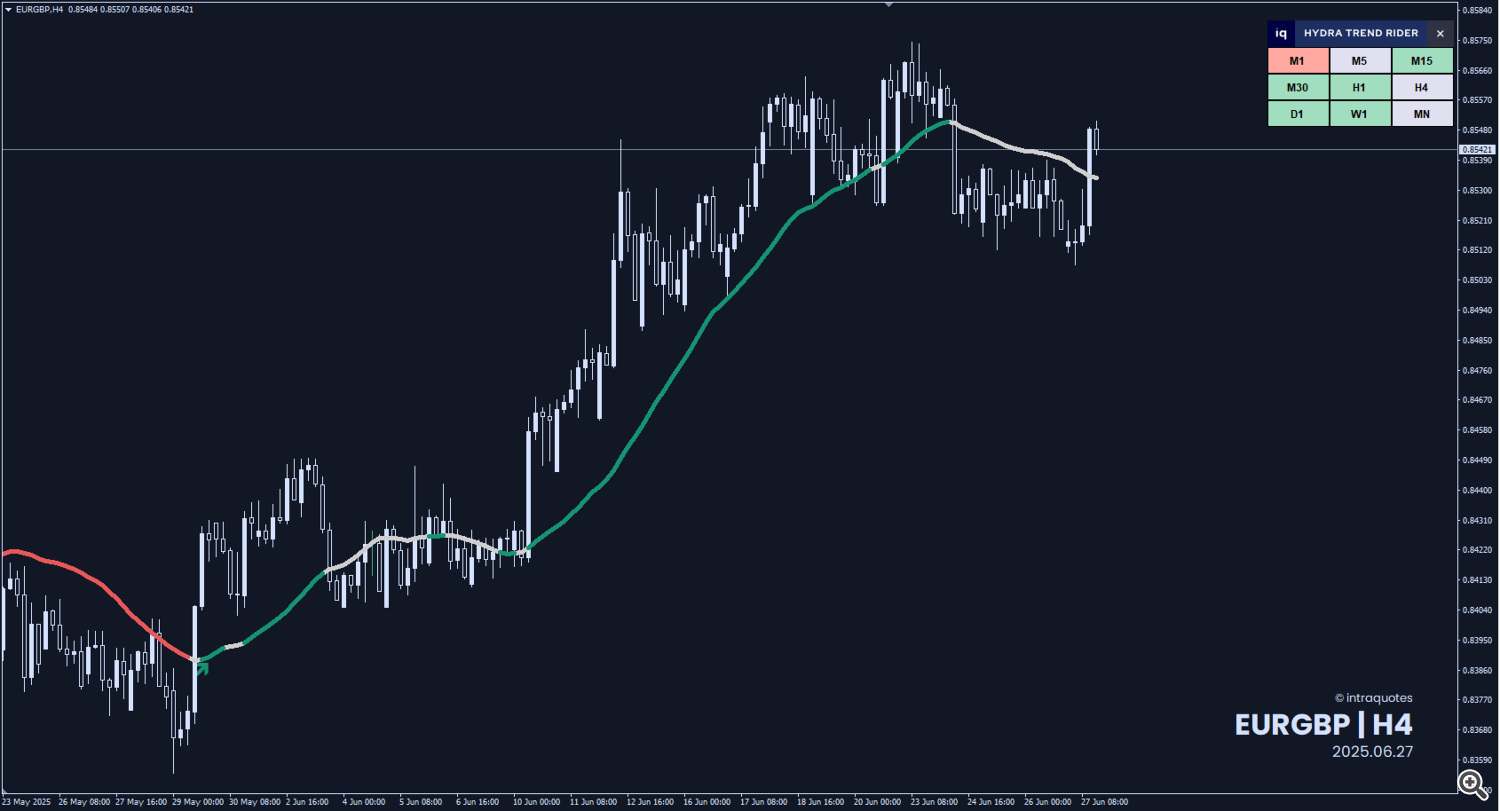
Fig.5: EURGBP range signal by the Hydra Trend Rider
Real-Time Range Analysis Strategy 2:
In the below picture of EURCAD, the candlesticks can be seen crossing over the Hydra line repeatedly without moving away from the same (as mentioned earlier, the further away the candlesticks from the line, the stronger the trend). This hints at a potential range market. Avoid trading in such market scenario to avoid financial losses. Hydra line + arrow signal may sometimes appear during range market. Your job would be to avoid them, not to take them as a signal if the candles are going to-and-fro though the Hydra line. Avoiding wrong entry is as important as knowing when to exit the trade.
This range analysis strategy again offers you a strategic advantage. With Hydra Trend Signals, you’re not just following trends; you’re getting to know when not to enter the market, when to exit the market, and also smartly avoid your losses.
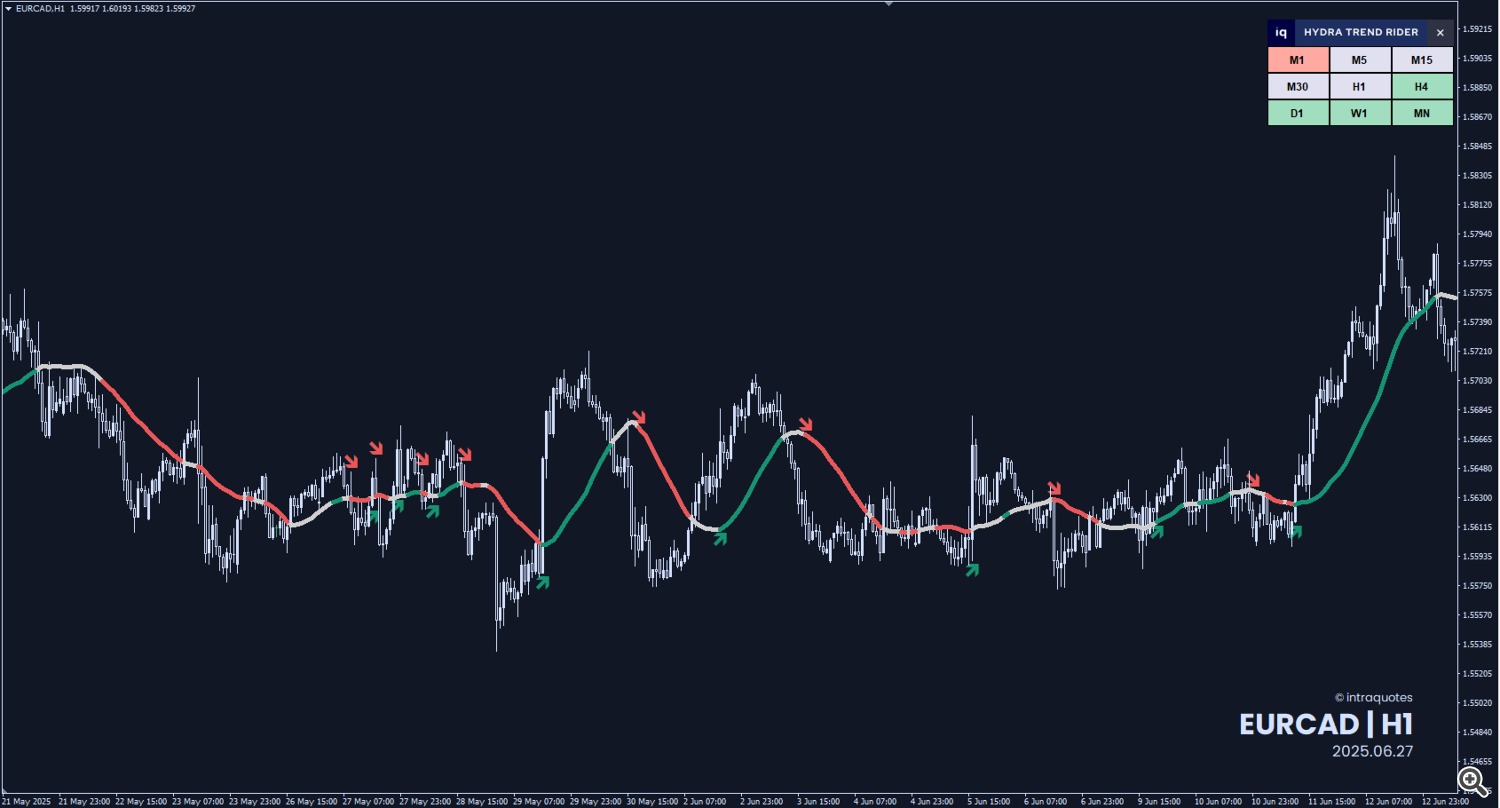
Fig.6: Candlesticks crossing over the Hydra Trend Line multiple times signaling range
🎁Bonus tips:
- For scalpers: A clear depiction of the ‘short-term’ signal will be advantageous.
- For day traders: Look out for the ‘mid-term’ signals.
- For swing traders: Your go-to signal should be ‘long-term’.
This super indicator can easily track and predict trend continuations or reversals, empowering you with the knowledge to act confidently.
2. Trend Following
Ride the trend by identifying higher highs and higher lows during a robust uptrend or lower lows and lower highs in a strong downtrend. Check the example of a real market chart below.
3. Position Trailing
Trail positions during strong trends, ensuring a sustained rise in higher highs or lower lows. When a trend is strong, the Hydra line goes gray and the candlesticks touch the Hydra line, you should either consider closing the trade, and entering again if the line color changes signaling a good trend, or trail your position if you are already in good profit to avoid closing the trade in losses.
4. Good Signal Entry
🟢 Green Signal: Look for long bull candles with higher highs and higher lows or breakthroughs of previous highs for a strong uptrend.
🔴 Red Signal: Seek long bear candles with lower lows and lower highs or breakthroughs of previous lows for a compelling downtrend.
5. Entering a Trade After Correction
After a gray signal if a green line appears, along with an entry arrow, wait for a candle with higher high bars for re-entry into an uptrend. Apply the same principle for downtrend correction.
More Trading Strategies Combining Hydra with Other Indicators
1. Using Hydra Indicator with IQ Gold Gann Levels – Read here.
(More links will be updated here as we release more strategies with other indicators).
Video Guide:
Indicator Troubleshooting
1. How to set mobile alerts from MetaTrader Desktop:
Step 1: Choose Tools -> Options from the Menu.
Step 2: Click on the Notification Tab. Enable the Push notification.
Step 3: Enter your Metaquotes ID (You can see this ID in your mobile Metatrader app settings) and then press Test.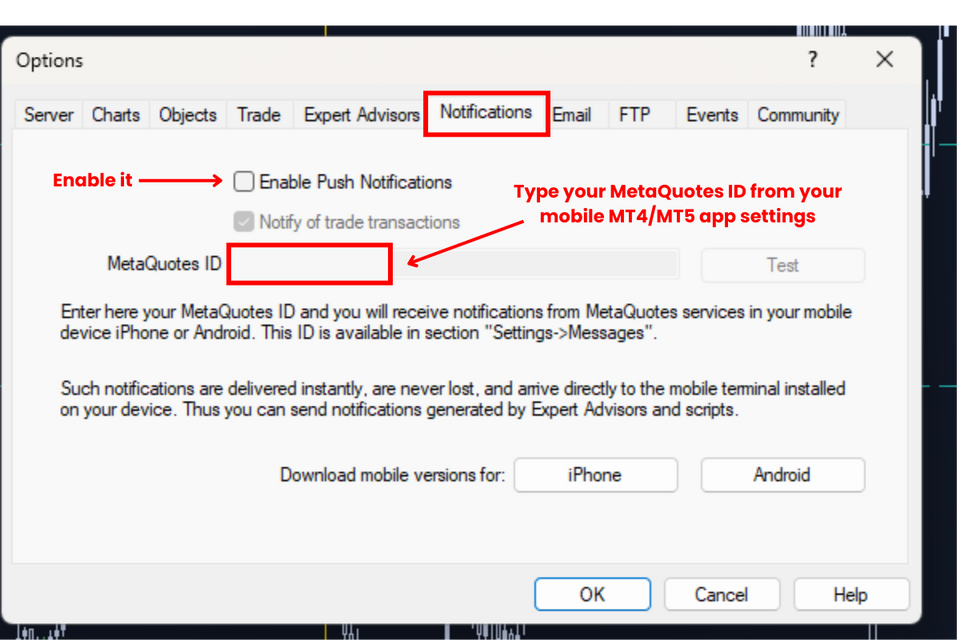
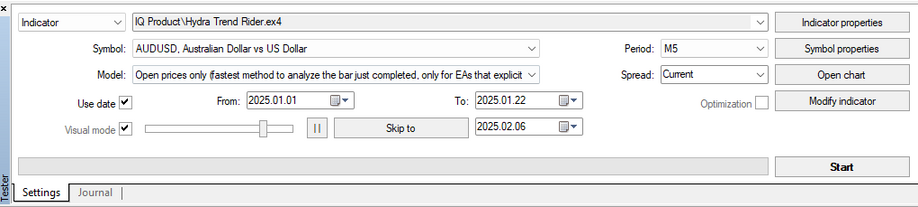
2. How to Start the visual backtesting:
Step 1: Press Control + R to open Strategy Tester or from the view menu click on Strategy Tester.
Step 2: Select a Symbol from the symbol drop-down.
Step 3: Select the Hydra Trend Rider Indicator from the Indicator drop-down. (You can find it in the Market folder).
Step 4: Select Model to (Open Price Only) for faster backtesting.
Step 5: Enable ‘Use Date’, and Select your ‘From’ and ‘To’ dates.
Step 6: Enable the Visual mode.
Step 7: Select any period from M1 to MN.
Step 8: Keep the spread selected as Current.
Step 9: Click on the start button to start visual backtesting.
Note: It might take some time initially to load the data and test the data with the indicator.
3. Possible Issues with Backtesting:
Problem 1:
You see a message that says “Waiting for update” on the chart while backtesting.
Solution:
This means that you don’t have enough data or a poor internet connection. To avoid this, make sure you download the full History Center data as explained above.
Problem 2:
Metatrader freezes during backtest.
Solution:
This also happens because of insufficient data or a bad internet connection. Fix the internet connection before starting and follow the steps again.
4. Possible Issue with the Indicator Dashboard:
❓What if the dashboard seems squished or can’t see the data?
➡️ If your indicator dashboard looks squished and you can’t read the data properly, it is due to the scaling issue of MetaTrader. Follow the simple steps explained in the picture given below to fix the issue.
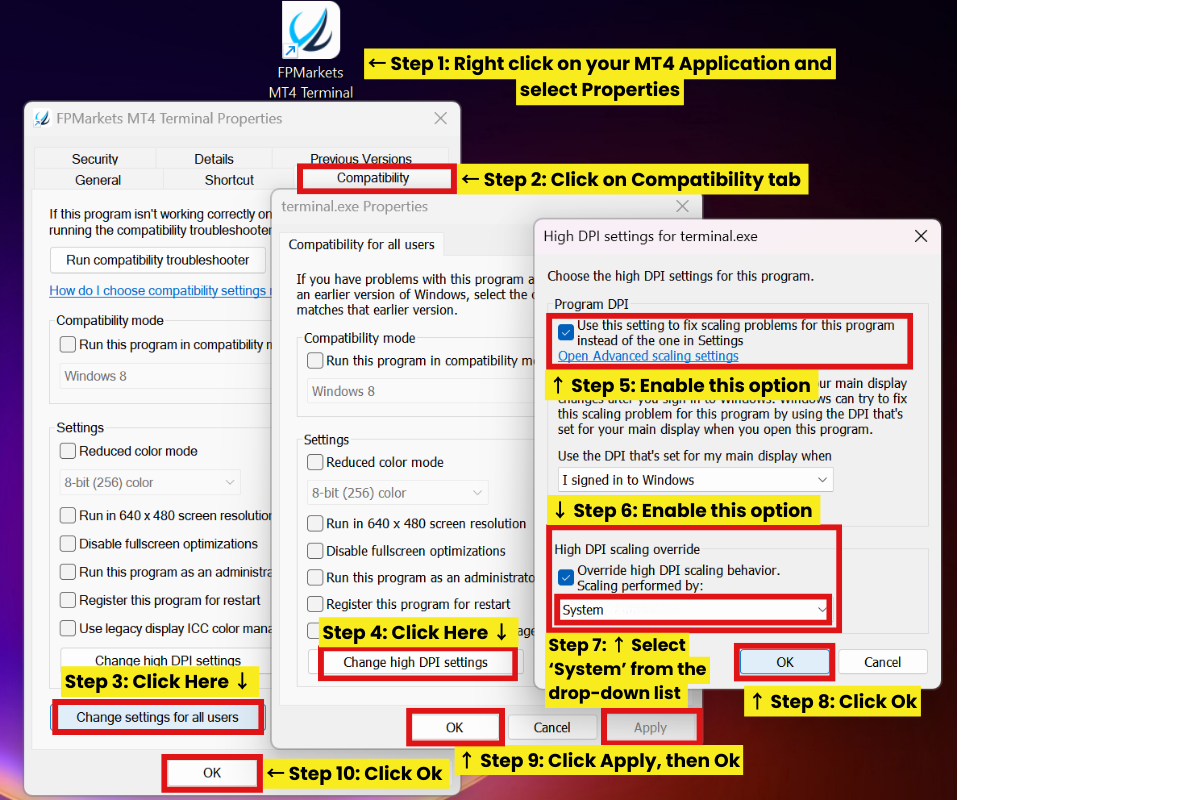
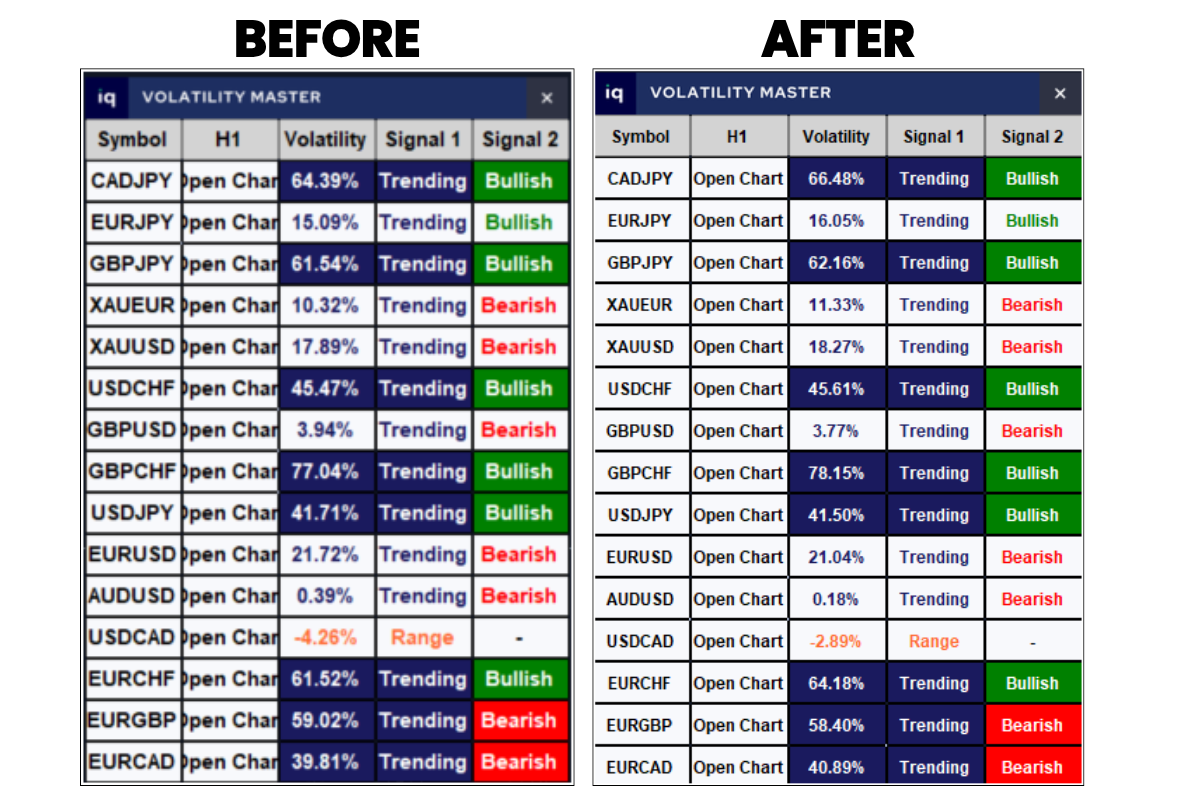
Image of Volatility Master indicator dashboard used here as an example.
Product Links : MT4 | MT5
Join Official MQL5 Channel for daily market update and to learn more about the Gann trading.
Also Check out: Seller Page | Welcome Post
🤝🏻 Let’s connect:
Telegram | Threads | YouTube
Disclaimer:
• Trading involves financial risk. Know all the risks before investing. Read all the Terms & conditions of each of the product pages before purchasing indicators.
• Our products are available only on mql5.com.
• We never contact anyone or sell our products privately.
• We do not provide any personal trading advice.
• We do not sell any of the Intraquotes products on Telegram or any other platform or website.
©intraquotes | DO NOT COPY THIS CONTENT
RISK DISCLOSURE
Trading financial markets carries inherent risks and may not be suitable for every investor. This indicator is designed as a tool to assist in trading decisions but does not guarantee profits or prevent losses, which could exceed your initial investment. Past performance is not a reliable indicator of future outcomes. Users are encouraged to fully understand the risks and seek independent financial advice if needed. Any trading decisions made using this indicator are at the user’s discretion and responsibility.
COPYRIGHT NOTICE
This user manual and its contents, including text, graphics, and code samples, are the exclusive property of Intraquotes. All rights reserved.
Unauthorised reproduction, distribution, modification, or use of this document, in whole or in part, without prior written permission from the copyright owner, is strictly prohibited. This document is provided exclusively to verified buyers of the associated indicator on MQL5.com. Sharing or distributing this document to others is a violation of copyright law.
The information provided in this manual is for personal use only and is intended to assist with the use of the associated indicator. The author assumes no responsibility for any misuse of this material or any trading decisions made based on its contents.
Join our official MQL5 Channel to stay updated with the latest market analysis, and product updates.
💎 Intraquotes Other Services:
Forex Brokers
🤝🏻 Let’s connect:
Telegram | Threads | Facebook | YouTube