
There are many ways to do credit spreads.
Traders can fine-tune their credit spreads to achieve a particular risk-to-reward ratio based on market outlook, volatility, and personal risk tolerance.
They can shift the balance between potential profit and maximum loss.
Understanding how to manage these variables is essential for optimizing returns while maintaining appropriate risk exposure.
Let’s learn how.
They apply to both bull put credit spreads and bear call credit spreads, but we will use put credit spreads in our example.
Contents
We start with a typical out-of-the-money (OTM) bull put credit spread.
Take Amazon (AMZN) as an example.
Date: May 16, 2025
Price: AMZN @ $205.59
Buy one Jun 20 AMZN $180 put
Sell one Jun 20 AMZN $190 put
Credit: $100
The risk graph at expiration looks like this:
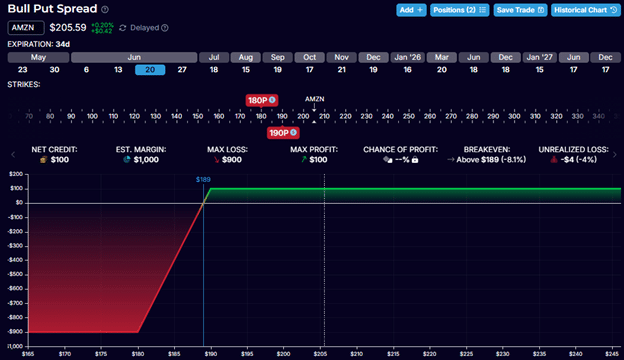
The initial credit received of $100 is the maximum return we can get from this trade.
This is the maximum reward.
The max risk, as seen by the lowest point on the risk graph, is $900.
This is the maximum loss of the trade.
The max loss is related to the width of the spread; the greater the width, the greater the risk.
If the trade goes completely bad with the price of AMZN below $180 per share at expiration, it means we have to buy AMZN at $190 per share (the short strike) and sell it at $180 per share (the long strike) – a loss of $10 per share.
Since one contract represents 100 shares, the spread risk is $1000.
Considering the credit of $100 that the trader received initially, the net loss in the worst-case scenario is $900.
The risk-to-reward in this trade is 9-to-1.
Risk-to-reward ratio = Max Risk / Max Reward = $900 / $100 = 9
The trader is risking $9 to make $1.
You can indeed adjust the risk-to-reward ratio by altering the width of the spread.
However, for the purpose of today’s discussion, we will focus on adjusting the risk-to-reward by moving the location of the spread on the option chain.
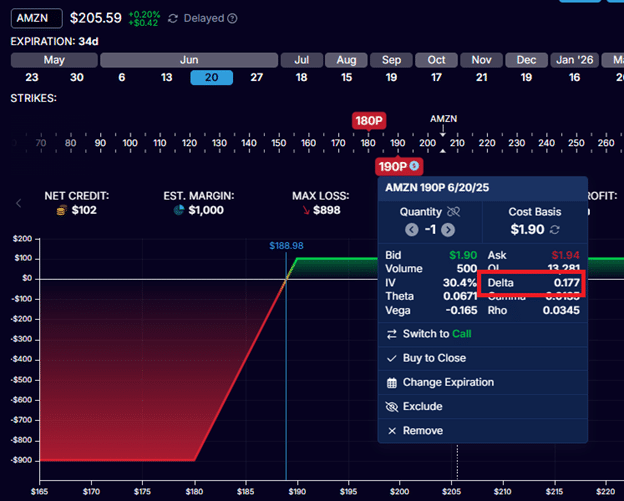
The option chain or the analytics software shows that the $190-strike put option in the last example is at the 17-delta.
Now let’s look at the credit spread of the same width but closer to the money:
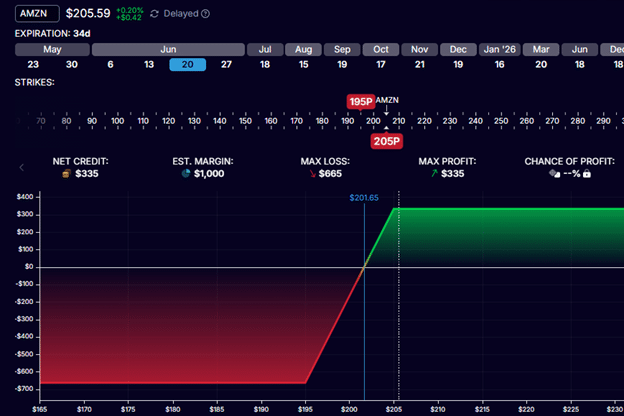
Here, we are selling the $205-strike put option and buying the $195 put option.
The short strike of $205 is at the 45-delta.
The trader collected $335 from selling this credit spread.
The risk-to-reward ratio in this example is 2-to-1.
How do I know?
Because the red-shaded area of the risk graph is twice as tall as the green-shaded area, that means that the risk is twice as much as the reward.
Or you can do the math.
The max risk is:
$1000 – $335 = $665
And so the risk to reward is $665 / $335 = 2
You might sometimes hear some traders say they want to collect one-third the width of the strikes.
This is an example of such.
The width of the strikes is $10.
The credit collected per share is $3.35, which is one-third of the width.
If the reward is one-third of the width, the risk is the remaining two-thirds.
The trader is risking two dollars to make one dollar.
Moving the put credit spread still further to the right on the price axis, we have an at-the-money credit spread:
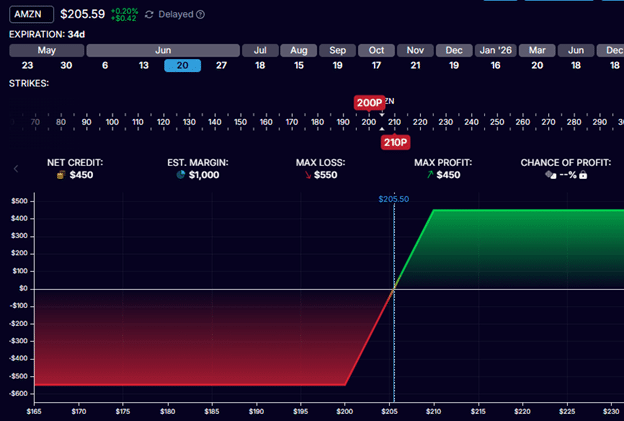
With AMZN at $205, the trader is selling the $210-strike put option and buying the $200-strike put.
The $210 strike is in the money (because AMZN’s price is below the put strike price).
And the $200 strike is out-of-the-money (because AMZN’s price is still above the put strike price).
The credit spread is at-the-money (ATM) because its legs are straddling the stock price.
In this case, we have nearly a one-to-one risk-to-reward, as you can see, and the green area is about equal to the red area.
To be precise:
Risk-to-reward ratio = $550 / $450 = 1.2
Where the max profit of $450 and max risk of $550 were already calculated for us by OptionStrat in the above screenshot.
We can move both of the put credit spread strikes to be in the money like this:
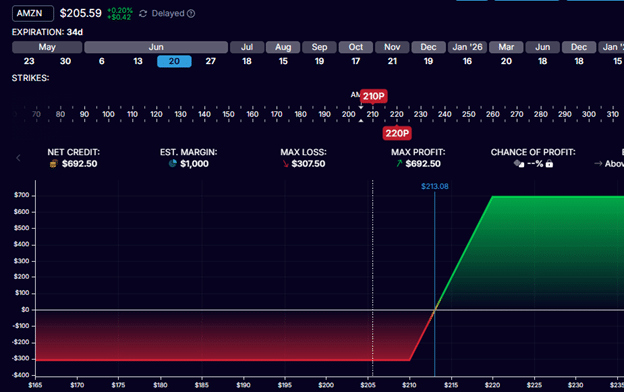
Selling the $220 strike and buying the $210 strike.
The price is below both put strikes.
So, both legs of this put credit spread in the money.
Now, the risk is smaller than the reward.
Risk-to-reward = $307.50 / $692.50 = 0.44
Looking at it another way, the reward is about twice as much as the risk.
Yes, this ITM put credit spread is equivalent to the following OTM call debit spread, where the trader sells the $220-strike call option and buys the $210-strike call option.
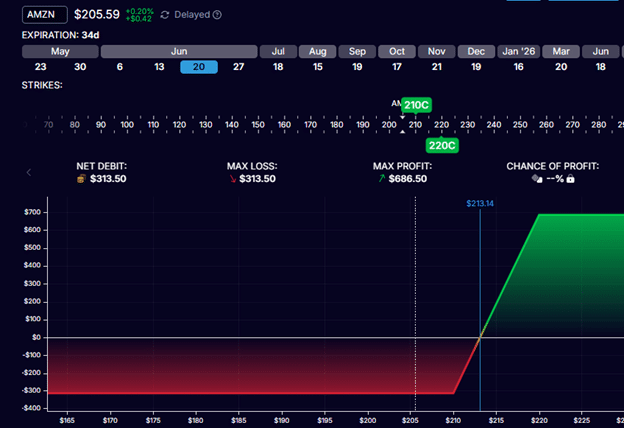
Because these are call options and both call strikes are above the current stock price, this is an out-of-the-money call debit spread.
The trader had to pay $313.50 to enter into this spread.
And that is also the maximum potential loss.
The risk-to-reward this OTM call debit spread is the same as the ITM put credit spread:
Risk-to-reward = $313.50 / $686.50 = 0.45
Because the bid/ask difference is smaller in OTM options than in ITM options, this OTM call debit spread tends to have a tighter bid/ask than the equivalent ITM put credit spread.
So, if a trader is looking for this type of risk-to-reward, it is preferable to trade the OTM call debit spread instead of the ITM put credit spread.
Besides that, everything else is the same between the two – including the Greeks.
One of the characteristics of credit spreads is that they have a positive theta where the P&L can accrue with time even if the stock price does not move.
This is true only of OTM credit spreads.
Here are the thetas for each of our examples:
OTM $190/$180 put credit spread: theta = 2.47
Near-the-money $205/$195 put credit spread: theta = 0.13
ATM $210/$200 put credit spread: theta = -1.6
ITM: $220/$210 put credit spread: theta = -3.8
As we move the spread closer to the money, we get less and less theta.
The ATM credit spread will be close to zero.
Moving the spread in the money, the theta becomes negative, causing the spread to behave more like a debit spread.
Credit spreads behave differently and have different risk-to-reward depending on where you place them on the option chain.
If credit spreads do not feel comfortable to you, perhaps it is not at the risk-reward ratio appropriate for your risk tolerance and/or trade thesis.
A very far out-of-the-money credit spread may cause one trader to feel like he/she is getting very little reward for the potential risk – like picking up pennies in front of a steam roller.
If that is the case, try a credit spread closer to the money.
You get a bigger reward and lower risk.
Another trader might find that the short strike of the spread is uncomfortably close to the stock price.
If that is the case, move the spread further out.
Like trying on shoes, you have to try credit spreads at different strikes and risk-to-reward to find ones that fit you.
We hope you enjoyed this article on adjusting the risk-to-reward ratio of credit spreads.
If you have any questions, send an email or leave a comment below.
Trade safe!
Disclaimer: The information above is for educational purposes only and should not be treated as investment advice. The strategy presented would not be suitable for investors who are not familiar with exchange traded options. Any readers interested in this strategy should do their own research and seek advice from a licensed financial adviser.

That Team Spirit run was insane! Seriously impressive strategy. Been checking out 987ph com for some fun bets & the platform seems legit – easy signup process too! Great article, thanks for the insights.