The Power of Line Break Charts in Trading: Unveiling Clarity in Volatility
This is the trial version of Line Break, get the full version here.
⬇⬇⬇ [FREE DOWNLOAD AT BOTTOM OF PAGE] ⬇⬇⬇
In the tumultuous world of financial markets, traders are constantly seeking tools that can help them filter out the noise and identify true trends. While candlestick charts dominate the landscape, alternative charting methods often offer unique perspectives that can significantly enhance analysis. Among these, Line Break Charts stand out as a powerful, yet often underutilized, instrument. This essay will delve into the history of Line Break Charts, explore their current challenges and solutions within MetaTrader 5, highlight the distinct advantages of using actual Line Break candles over mere overlays, discuss naked trading strategies, and finally, present various indicator-based approaches, empowering traders to unlock new dimensions in their analysis.
A Glimpse into History: The Genesis of Line Break Charts
The origins of Line Break Charts, much like their Japanese counterparts such as Renko and Kagi charts, can be traced back to Japan, where they were developed to analyze rice prices in the 17th century. While specific individual attribution is often difficult for these ancient charting methods, their collective emergence reflects a profound desire among early traders to move beyond simple time-based price plots. Instead of focusing on every minute fluctuation, these methods aimed to highlight significant price movements, thereby reducing market noise and presenting a clearer picture of underlying trends.
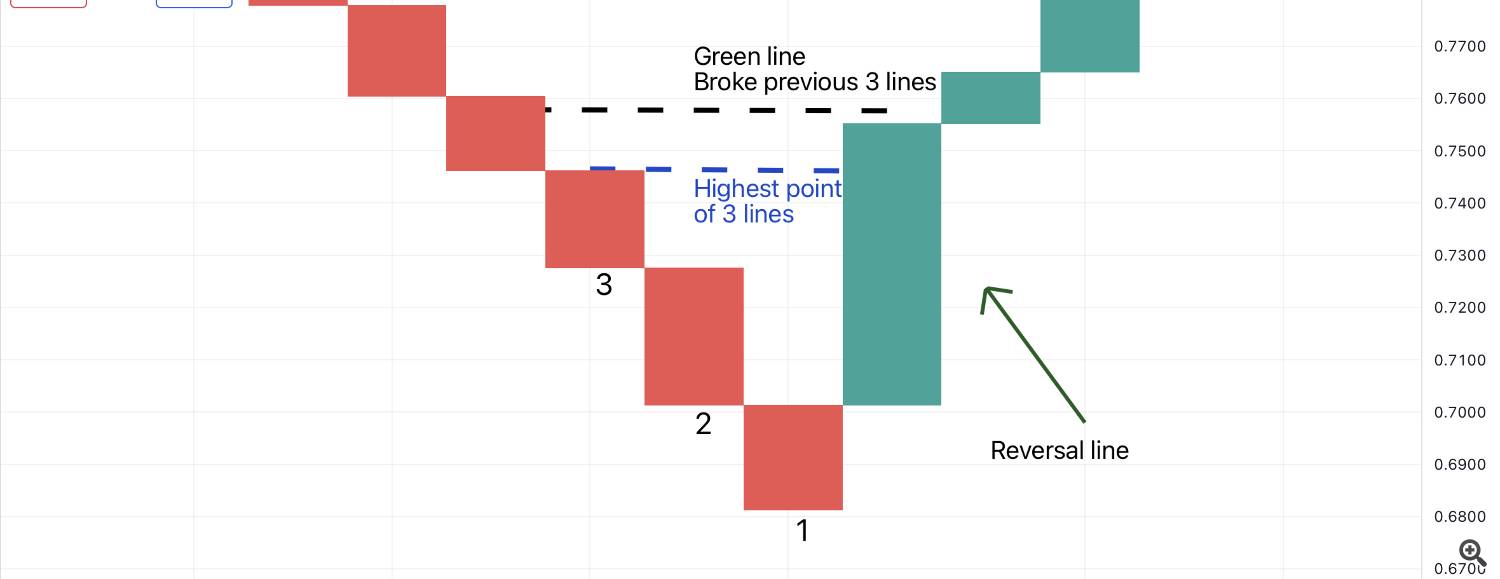
Line Break Charts, in particular, operate on a principle of “lines” or “breaks.” A new line is drawn only when the price moves by a predefined number of “breaks” or units in the opposite direction of the current trend. If the price continues in the same direction, the current line extends. This ingenious method effectively filters out minor corrections and focuses only on substantial shifts in market sentiment, presenting a smoother, more digestible view of price action.
Line Break Charts in MetaTrader 5: The Indicator Conundrum
Despite their historical significance and analytical power, MetaTrader 5 (MT5), a popular trading platform, does not natively support Line Break Charts as a standard chart type. This presents a significant hurdle for traders accustomed to the platform’s robust charting capabilities. Consequently, the market has seen a proliferation of “Line Break Chart indicators.” While these indicators attempt to replicate the visual essence of Line Break Charts, they typically function as overlays, plotting the Line Break price action directly onto a conventional candlestick chart.
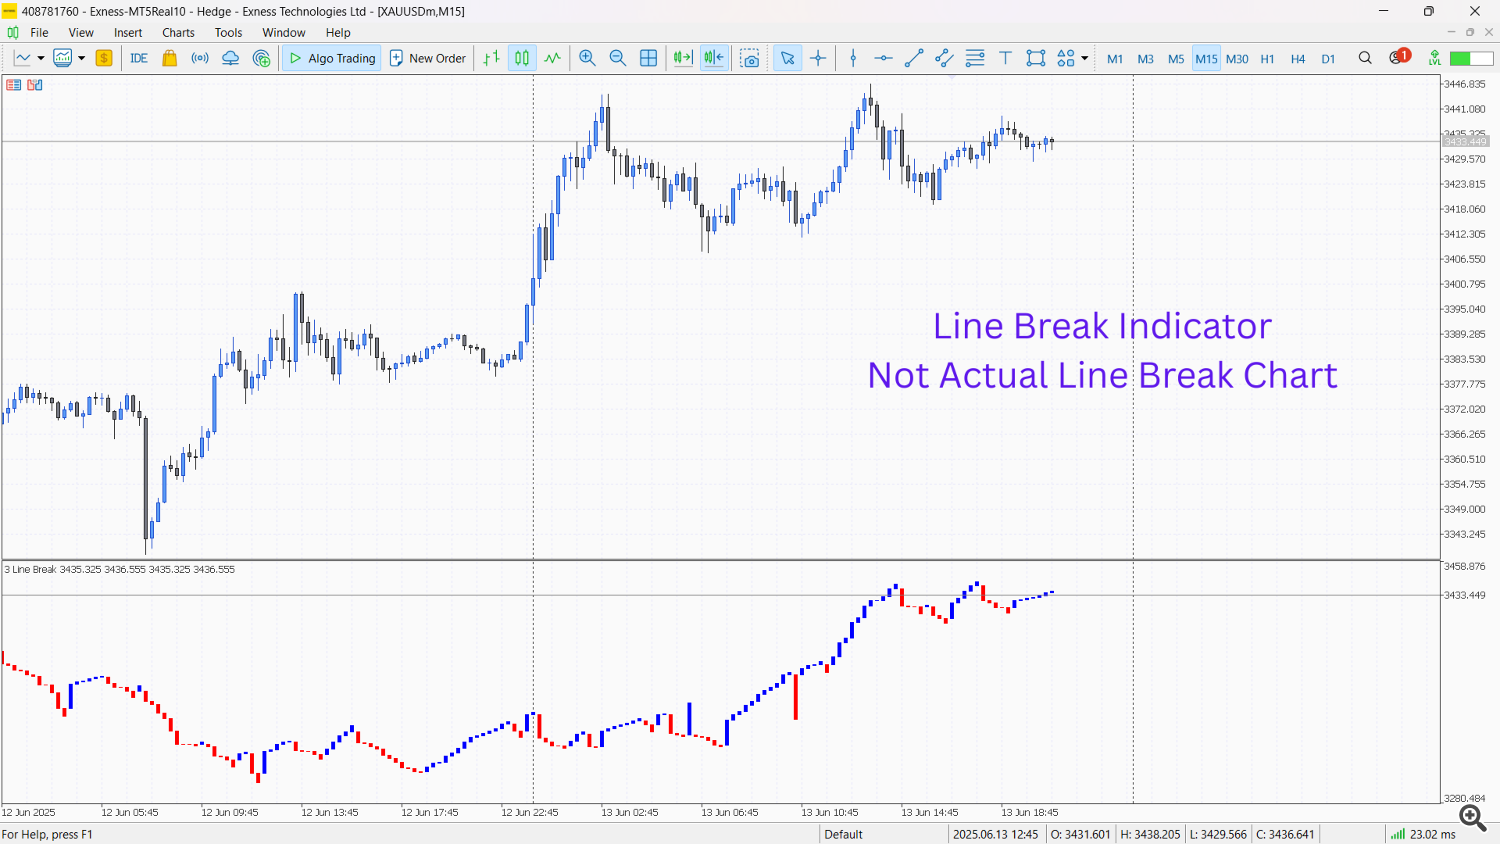

This approach, while providing some visual representation, comes with a critical limitation: these indicators do not generate actual Line Break candles or a true Line Break chart. They merely draw lines or shapes on top of the existing time-based candlesticks. This fundamental distinction has profound implications for a trader’s analytical toolkit.
The Expert Advisor Solution: Forging True Line Break Candles
The solution to MT5’s native Line Break Chart deficiency lies in the development and utilization of an Expert Advisor (EA). An EA specifically designed for Line Break Charts operates by converting raw price data (e.g., from a standard 1-minute chart) into true Line Break candles and then plotting these on a custom chart within MT5.
Here’s how such an EA typically functions:
- Data Collection: The EA runs on any timeframe, constantly monitoring incoming tick data.
- Line Break Logic: It applies the Line Break chart logic, determining when a new “break” has occurred based on a user-defined number of lines (e.g., a 3-line break chart means a reversal only prints after 3 previous lines are violated).
- Custom Chart Generation: When a new Line Break candle is formed, the EA writes this processed data to a custom chart. This custom chart then displays the true Line Break candles, independent of time.
This EA-driven approach is paramount because it provides traders with a genuine Line Break chart, where each “candle” (or line, more accurately) represents a significant price movement rather than a fixed time period.
The Undeniable Advantage: Actual Candles vs. Overlays
The difference between trading on an actual Line Break Chart generated by an EA and relying on an overlay indicator is not merely aesthetic; it is fundamentally functional and strategic.
Advantages of Actual Line Break Candles:
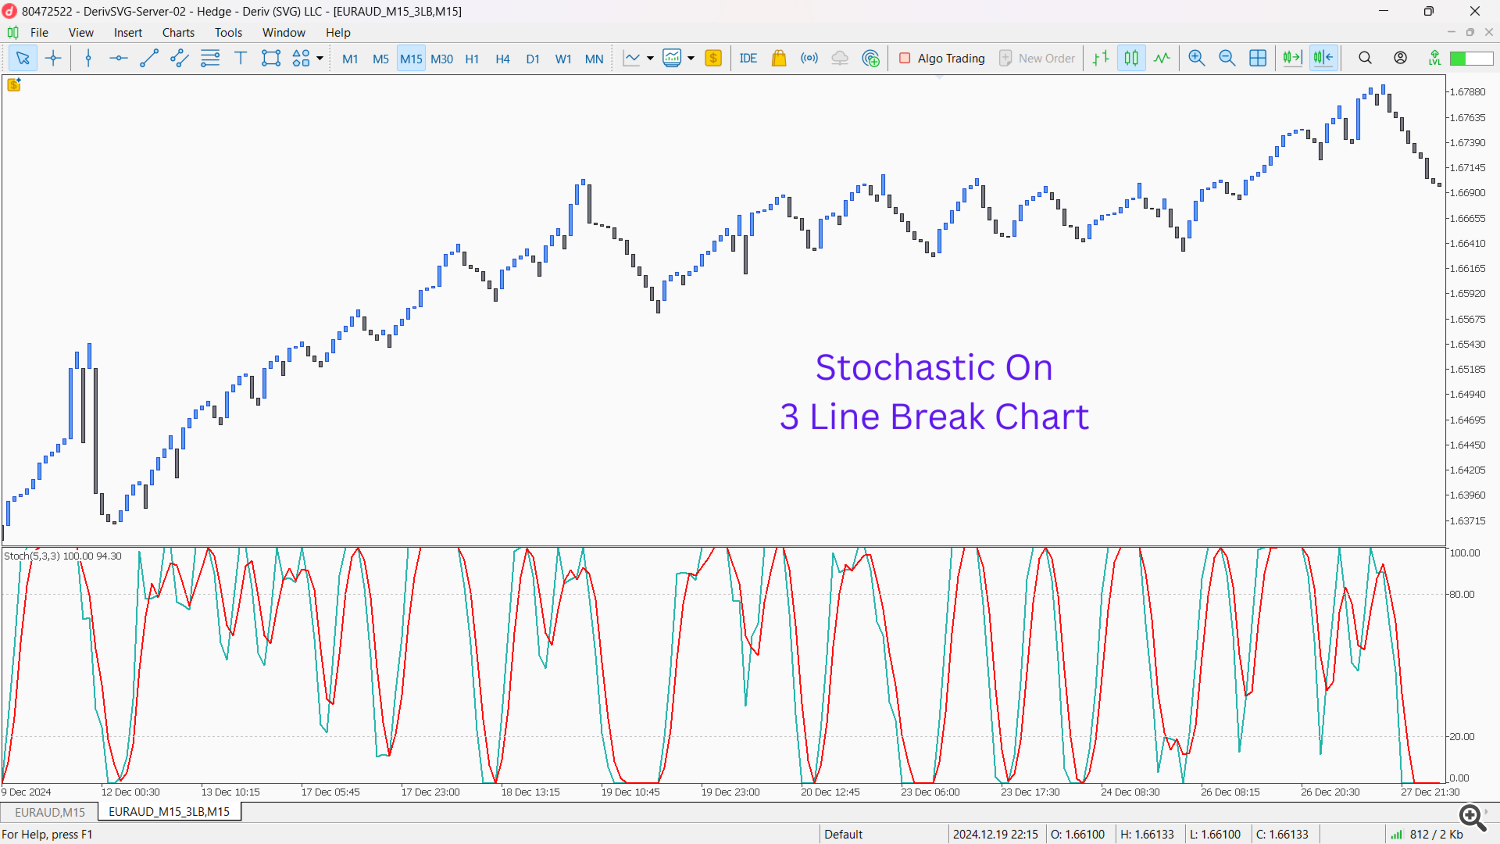
- Indicator Placement: This is arguably the most significant advantage. When you have a true Line Break Chart, you can apply any standard MT5 indicator directly onto these Line Break candles. Want to see how a Moving Average looks on a Line Break chart? Apply it. Want to use RSI or Stochastic? Apply it. This opens up a world of analytical possibilities, allowing you to combine the noise-filtering power of Line Break Charts with the confirmatory signals of your favorite indicators. With an overlay indicator, your indicators would still be calculating on the underlying time-based chart, not on the filtered Line Break price action.
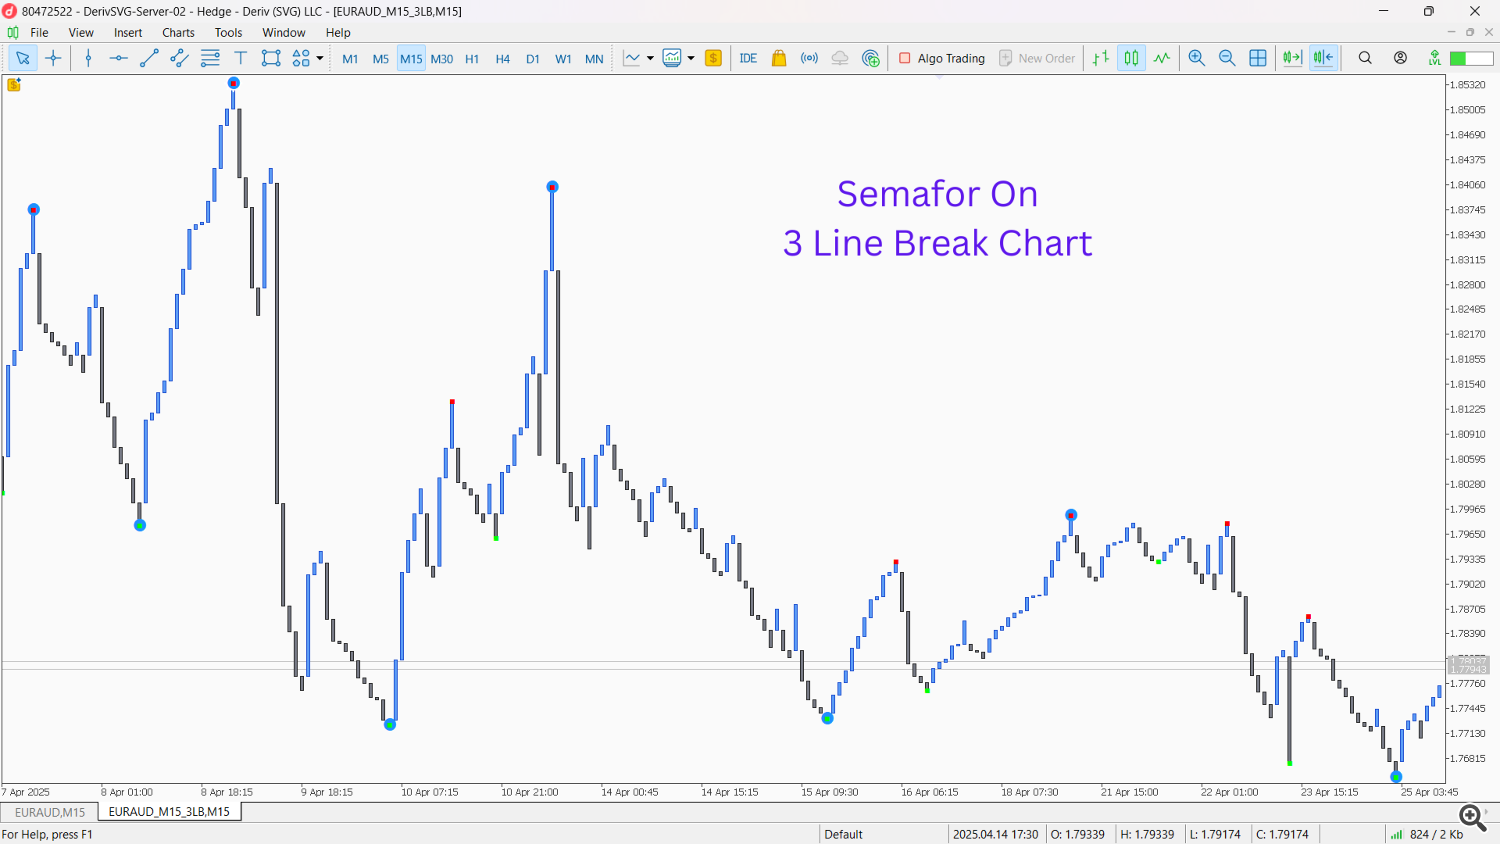
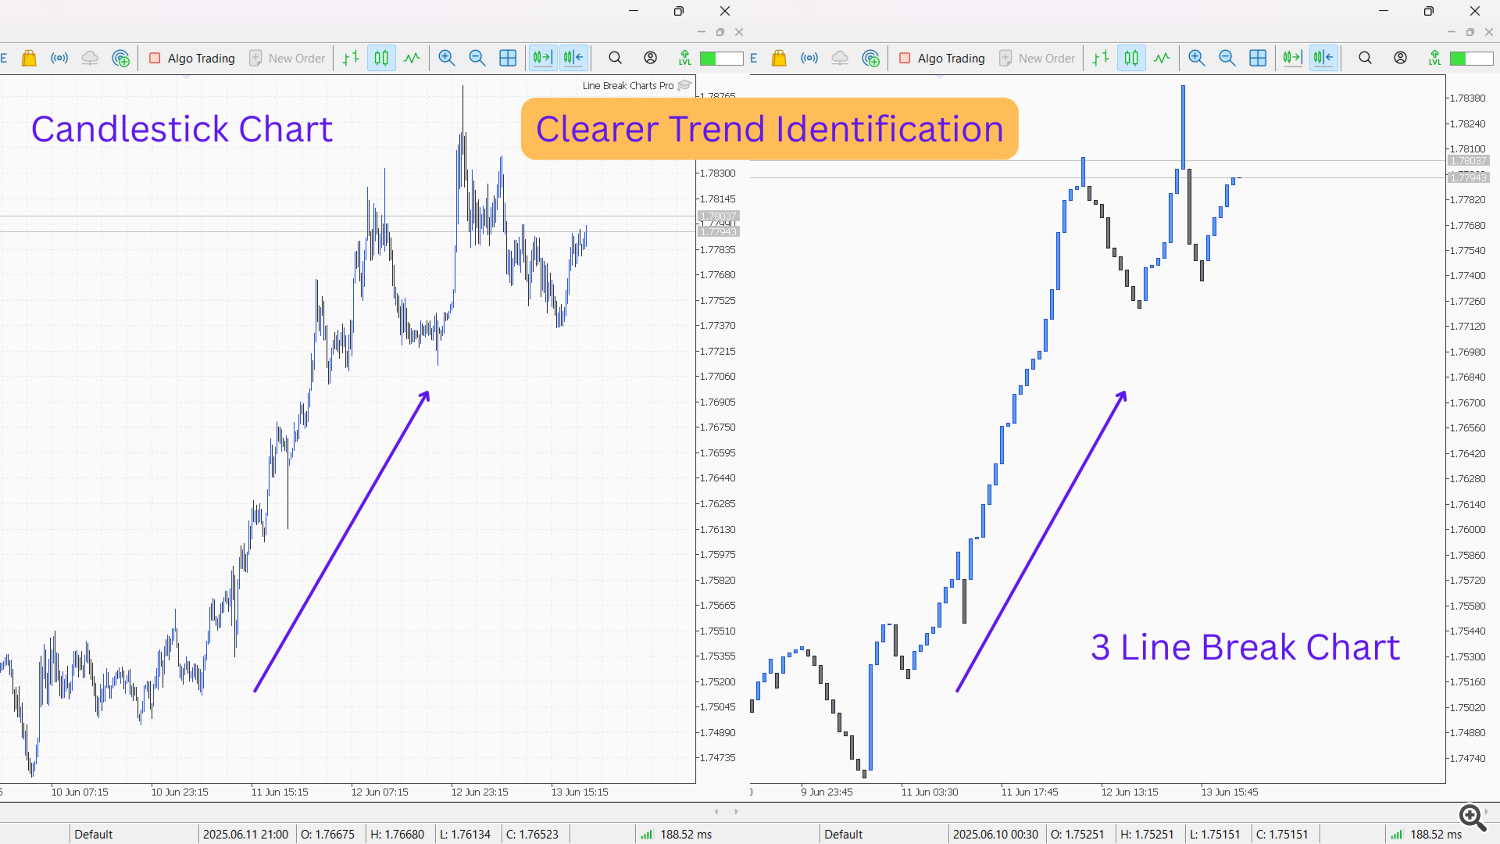
- Clearer Trend Identification: Actual Line Break Charts inherently smooth out price action, making trends much easier to identify. Choppy price action on a time-based chart often resolves into clear, directional lines on a Line Break chart, reducing whipsaws and false signals.
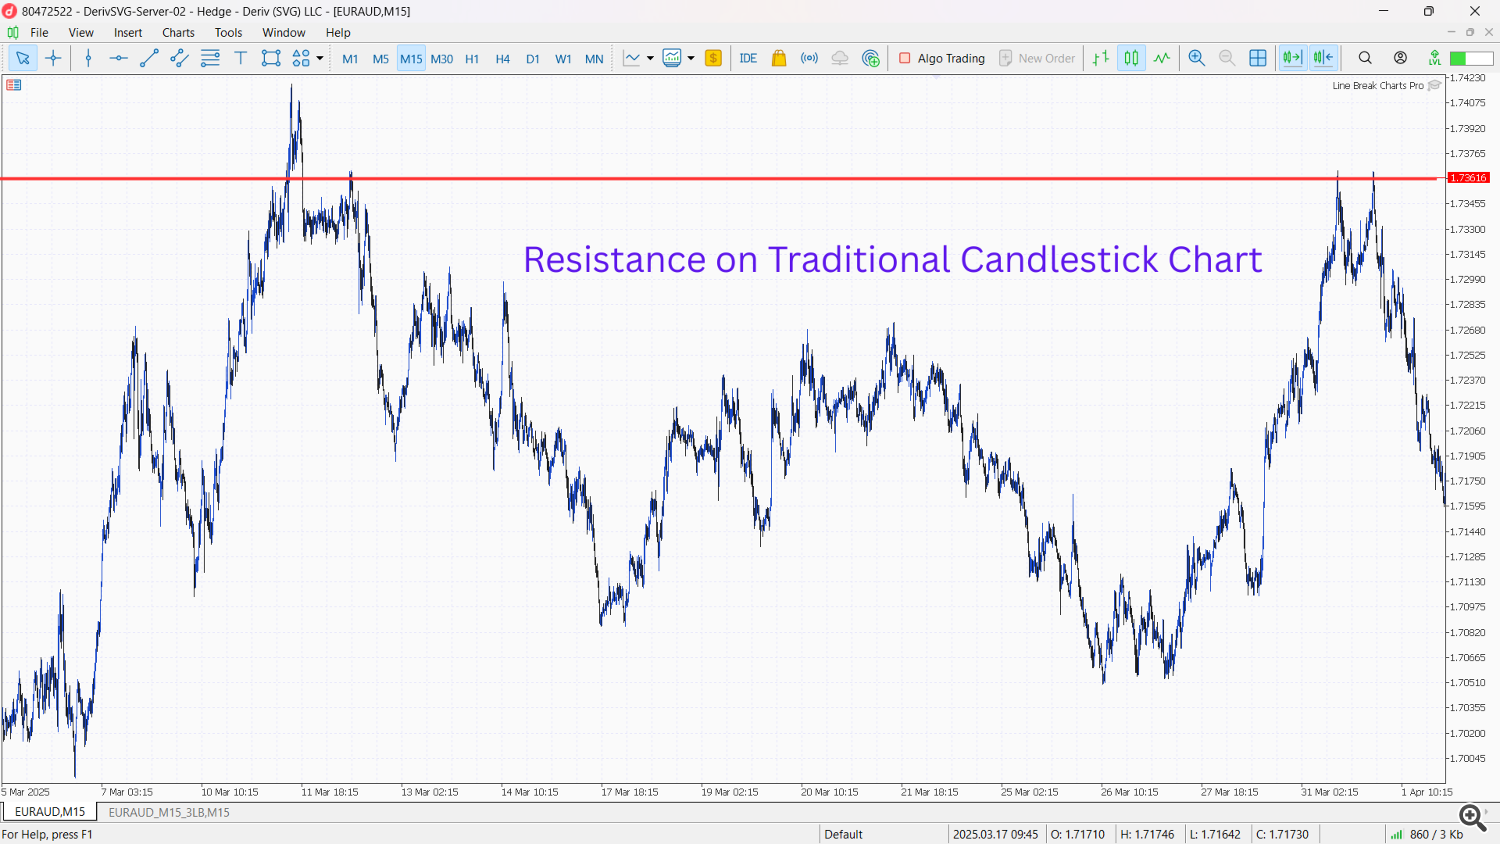
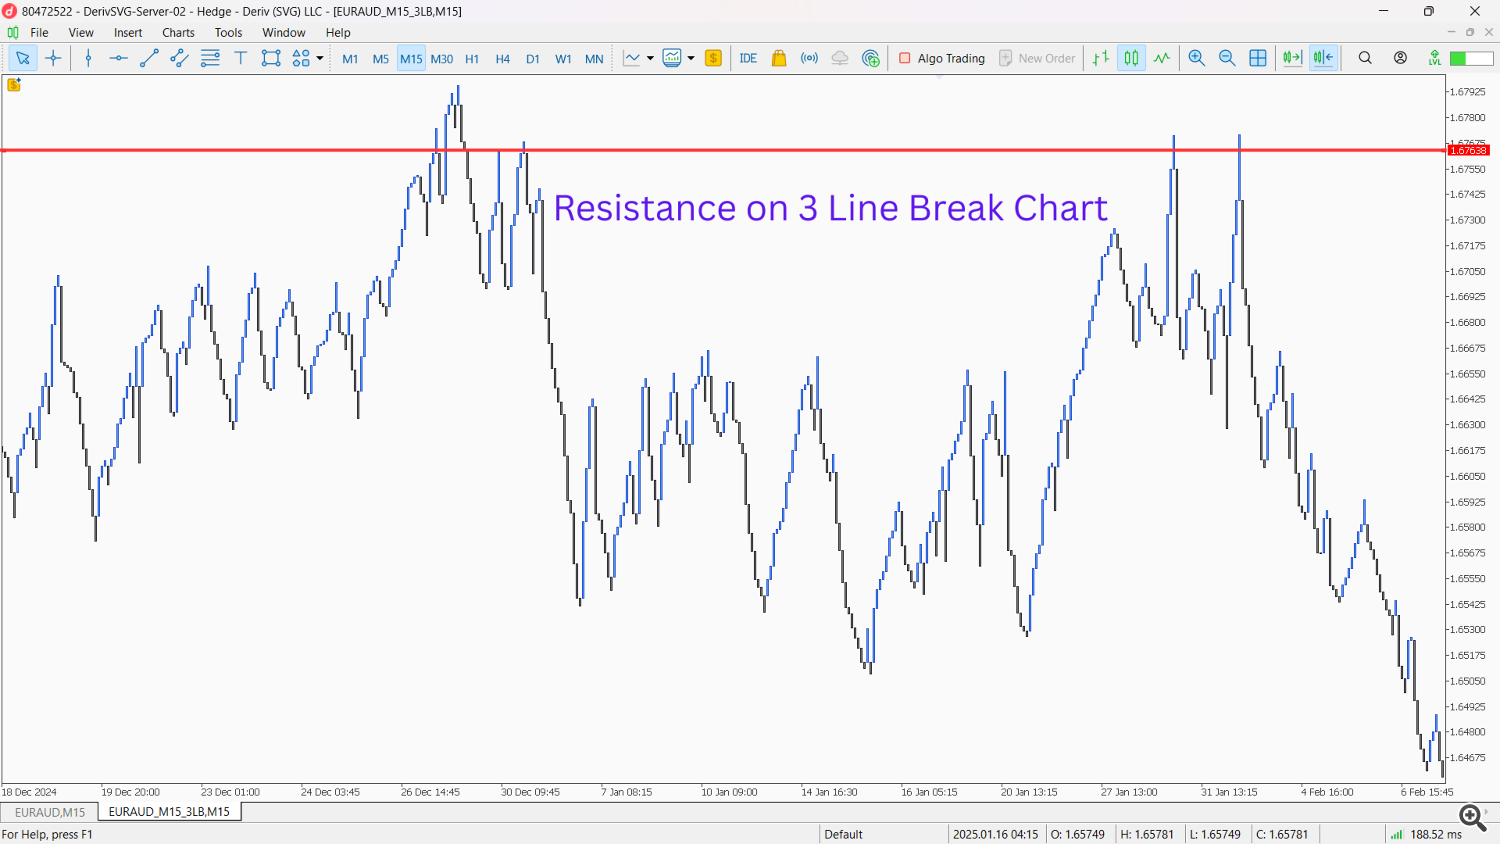
- Improved Support and Resistance: Because minor price fluctuations are filtered out, key support and resistance levels often become more pronounced and reliable on Line Break Charts.

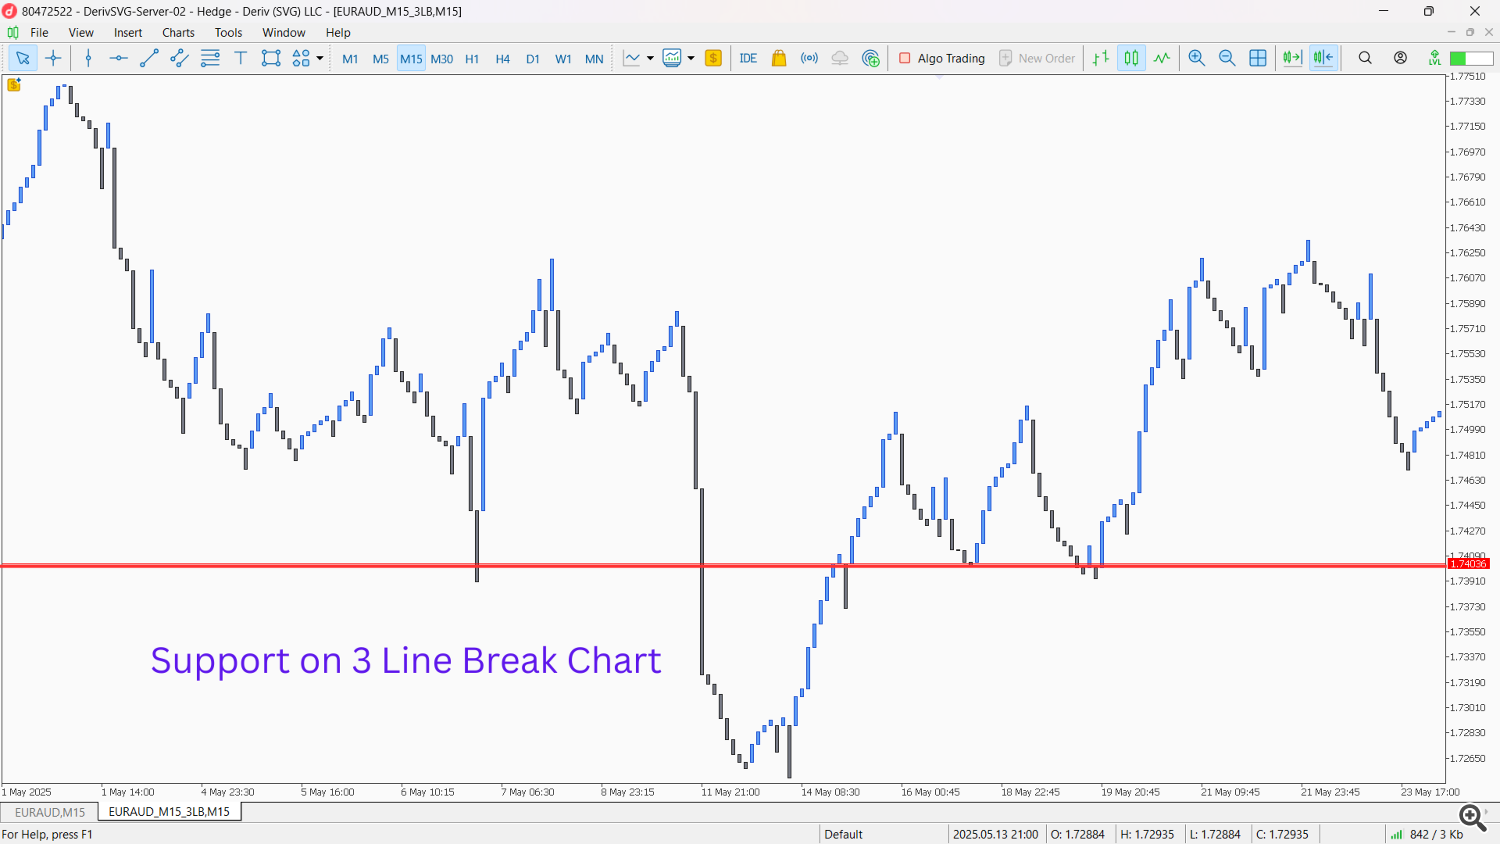
- Defined Reversal Signals: The very nature of Line Break Charts means that a new opposing line indicates a significant reversal of momentum, making reversal signals clearer and less ambiguous than on time-based charts.
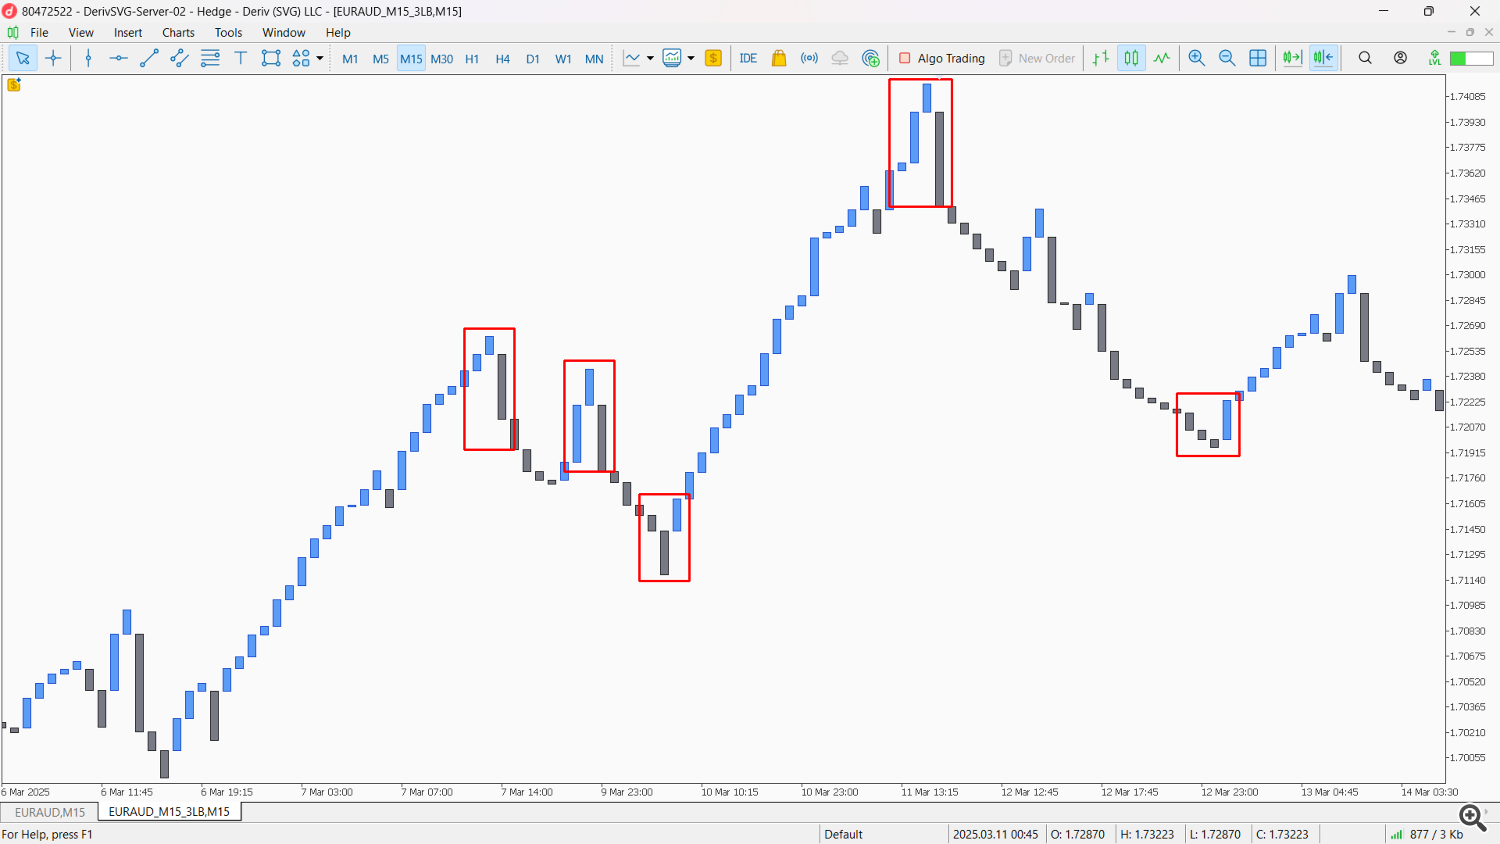
- Focus on Price Action: By removing the time element, Line Break Charts emphasize price action itself. This allows traders to focus solely on momentum shifts and structural changes in the market, rather than being distracted by time-based volatility.
Naked Strategies with Line Break Charts
One of the most compelling aspects of Line Break Charts is their ability to reveal clear price action, making them ideal for “naked” trading strategies – those that rely solely on chart patterns and price behavior without additional indicators.
- Trend Following (Pure Line Break): This is the most straightforward strategy. Identify the direction of the current line (up or down). Enter trades in the direction of the prevailing Line Break trend. For example, if you see a series of consecutive white/green (up) lines, you would look for long opportunities. Exit or take profit when a new opposing line forms.
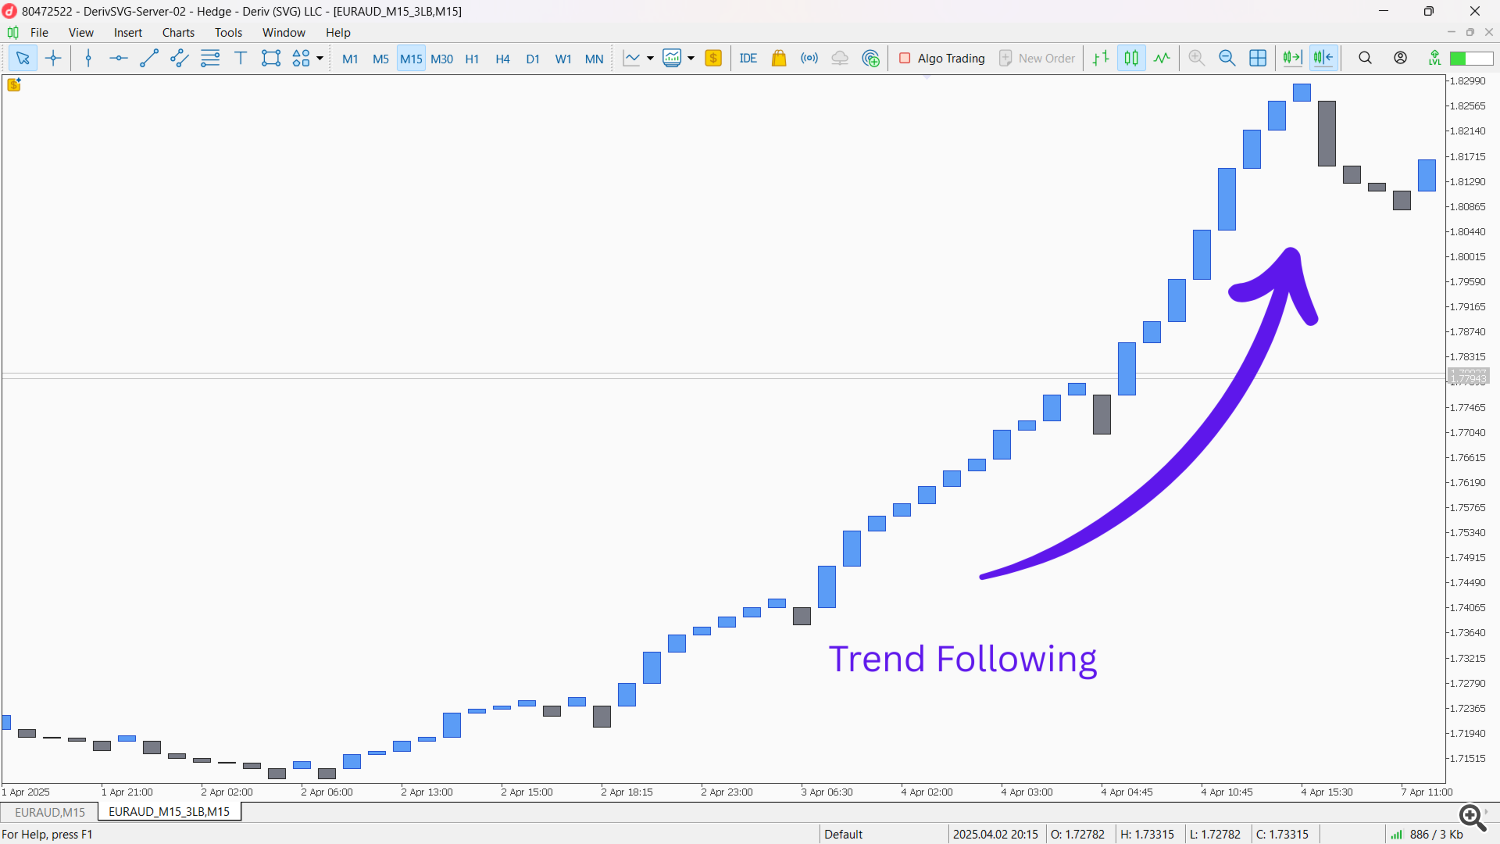
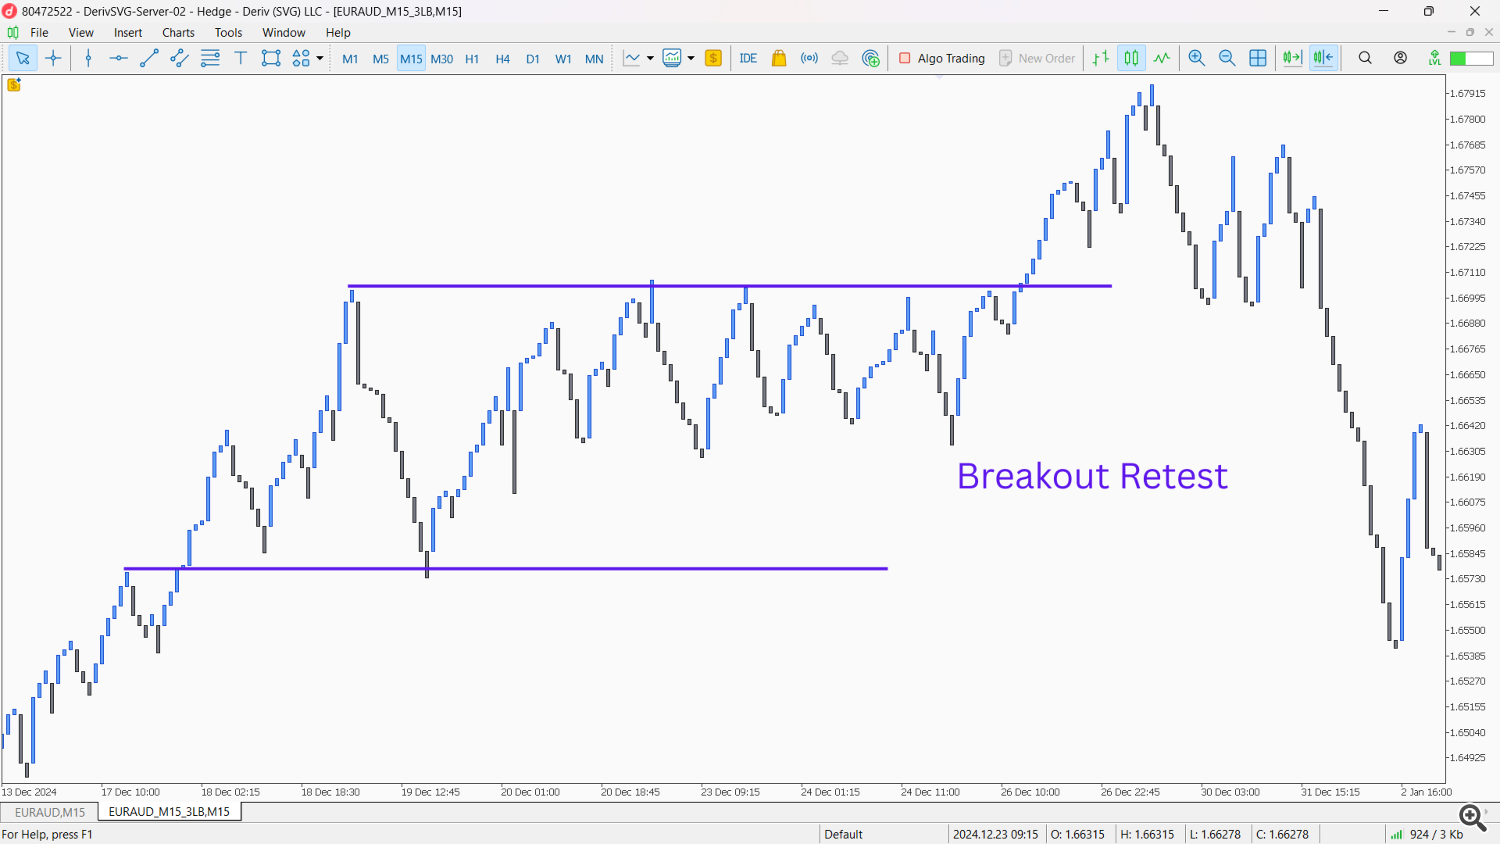
- Support and Resistance Breaks: With the clearer definition of significant price levels, traders can identify strong support and resistance. A break of a key level by a new Line Break candle (especially if it extends beyond previous highs/lows) can signal a continuation of momentum or a significant trend change.
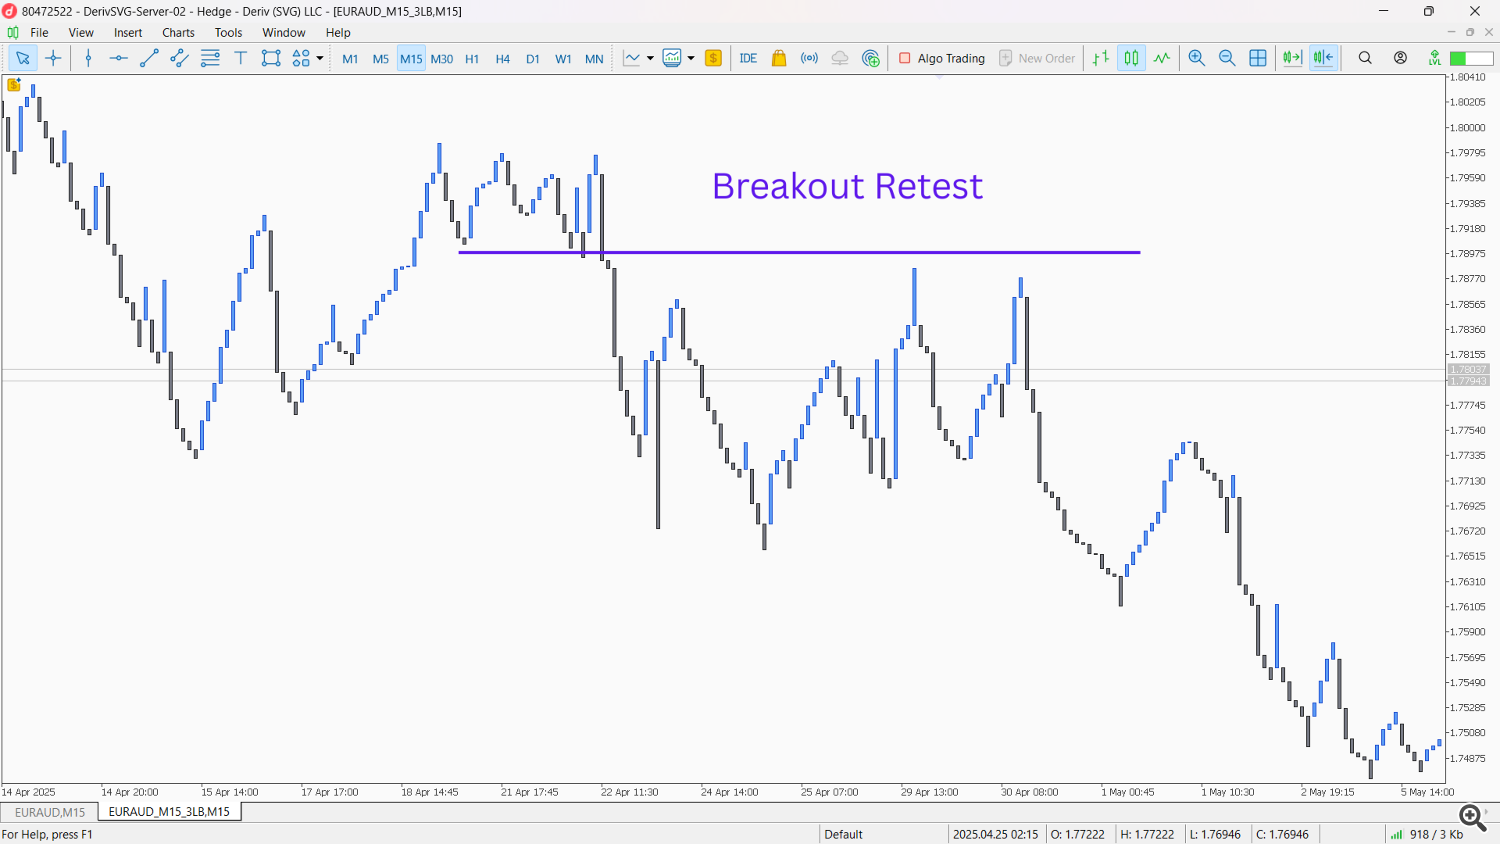
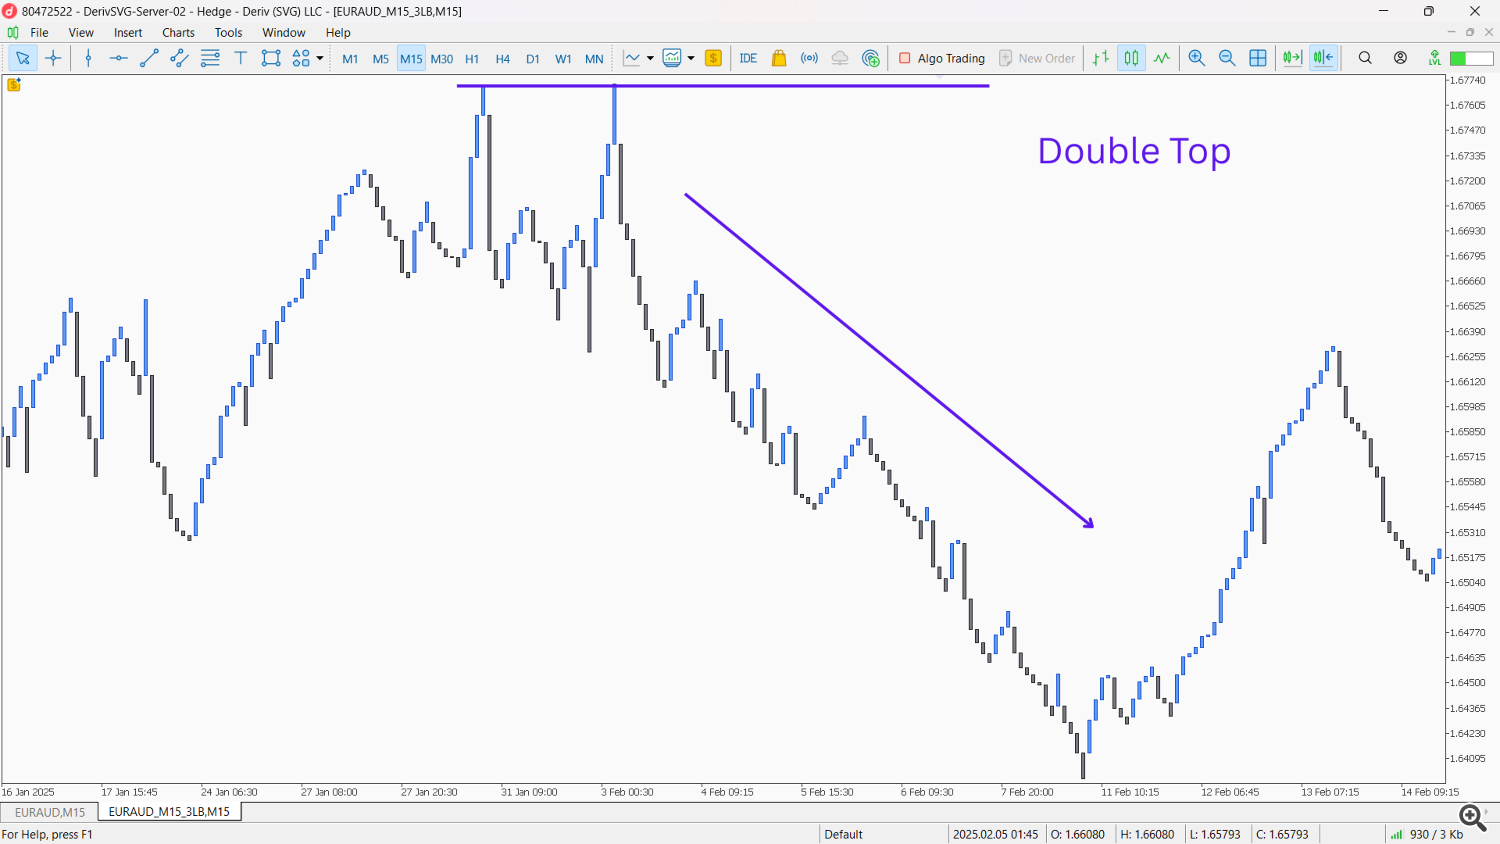
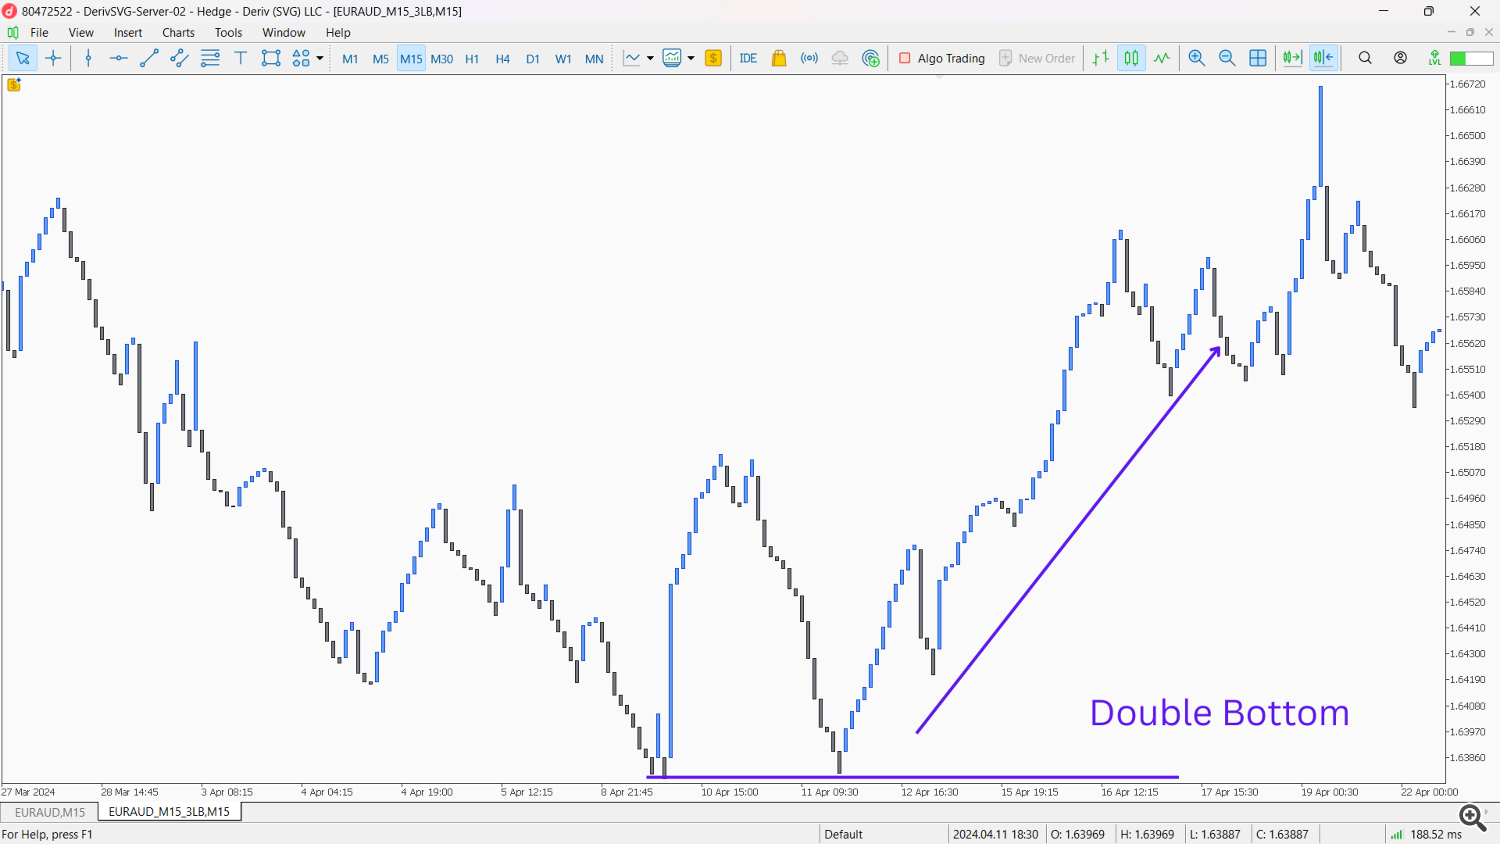
- Double Top/Bottom (Line Break Version): Look for traditional double top or double bottom patterns formed by the Line Break lines. For instance, after an uptrend, two peaks of similar height followed by a strong down-break Line can signal a reversal. These patterns are often much cleaner on Line Break Charts due to the noise reduction.
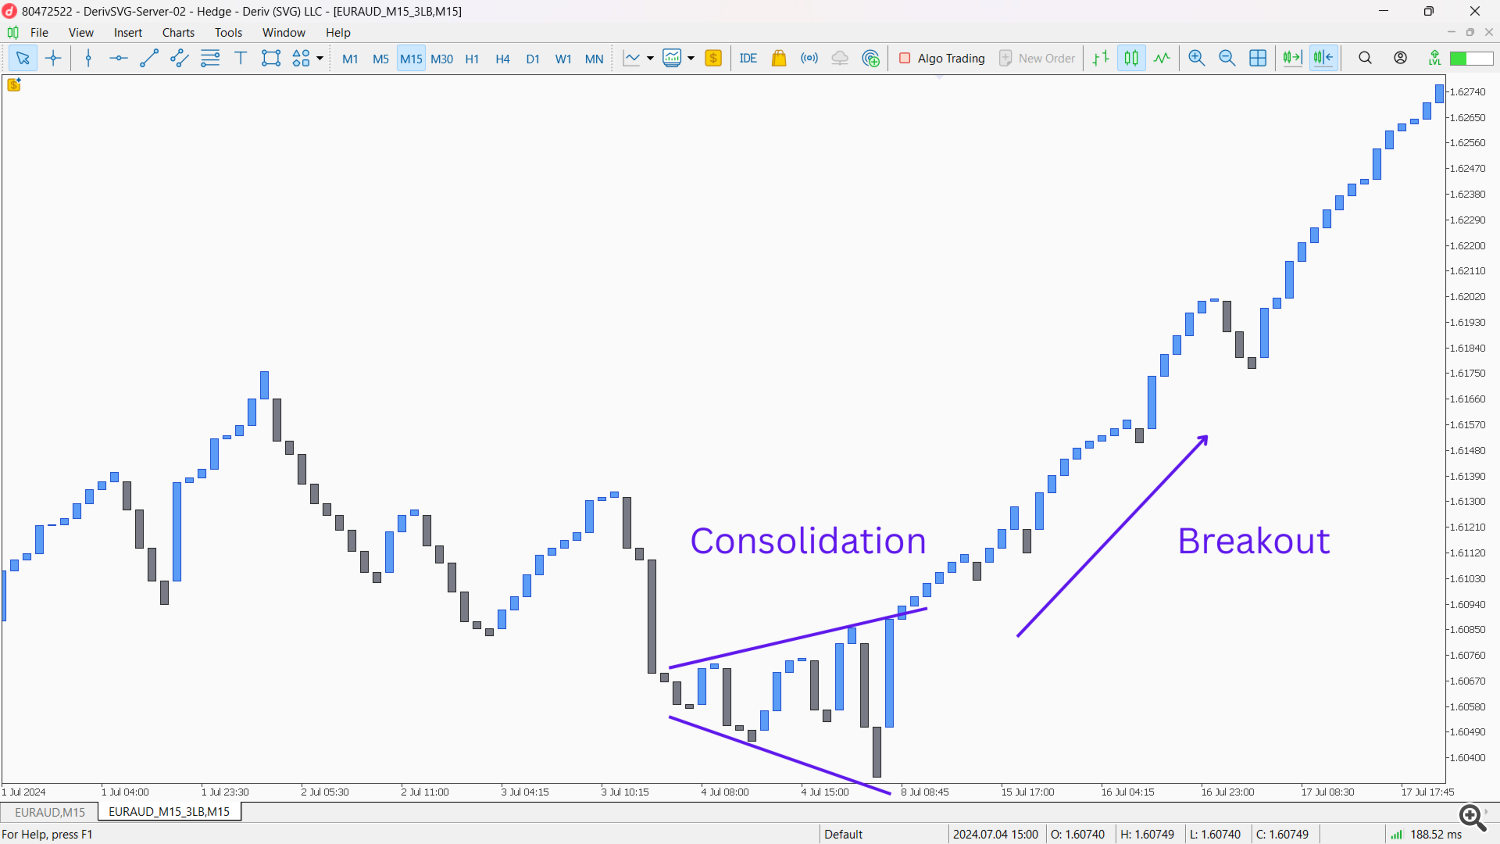
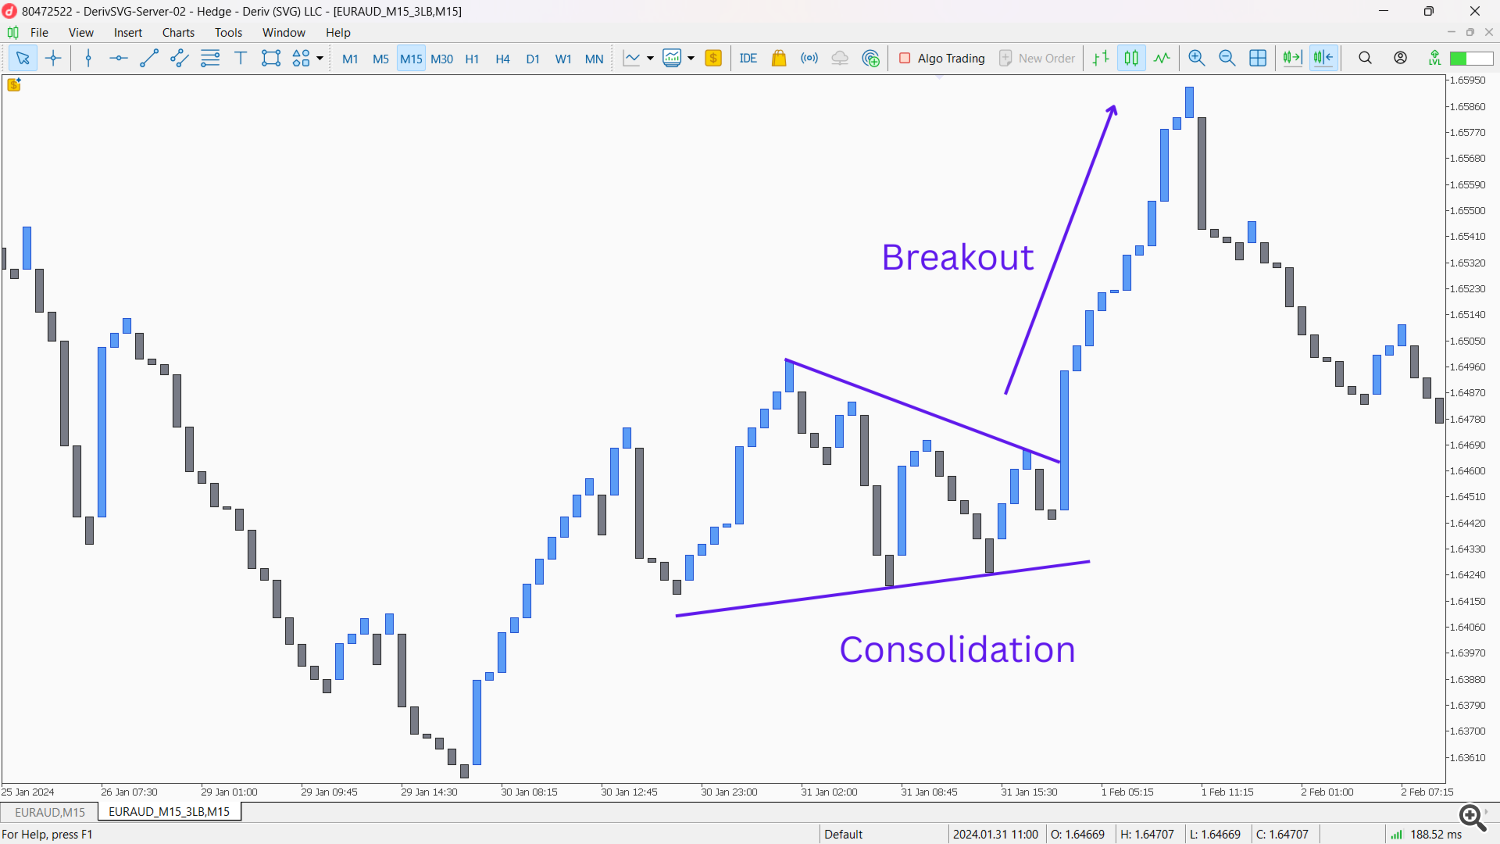
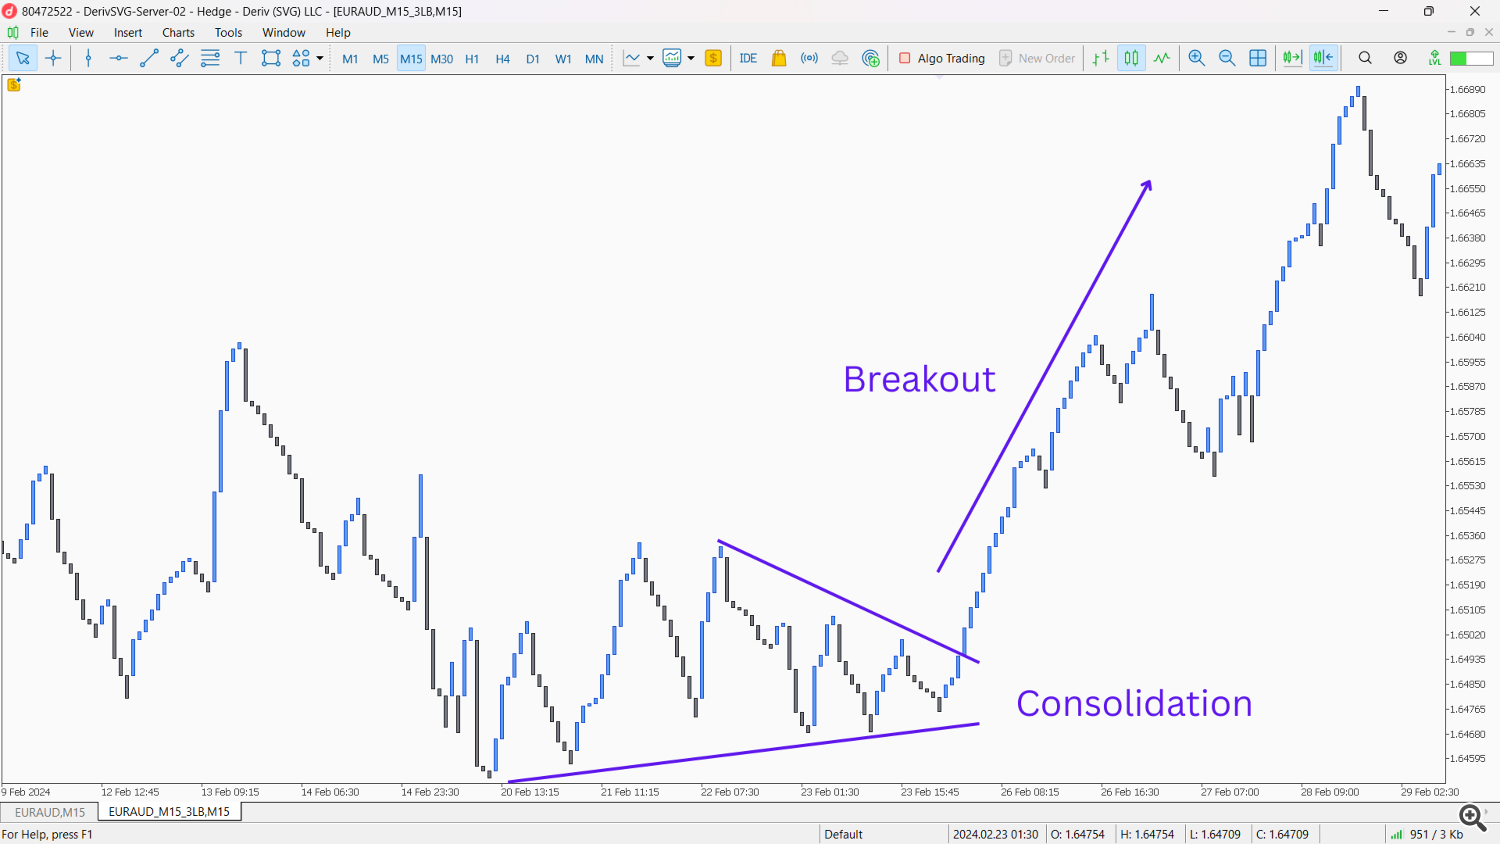
- Line Break Consolidation Breakouts: Observe periods where Line Break lines become flat or oscillate within a narrow range. A strong Line Break candle breaking out of this consolidation suggests a new directional move.
Strategies with Indicators: Enhancing Line Break Signals
While Line Break Charts provide excellent standalone insights, combining them with your favorite indicators on the actual Line Break chart can create highly potent strategies.
Continuation Strategies:
- Moving Average Crossover (on Line Break Chart):
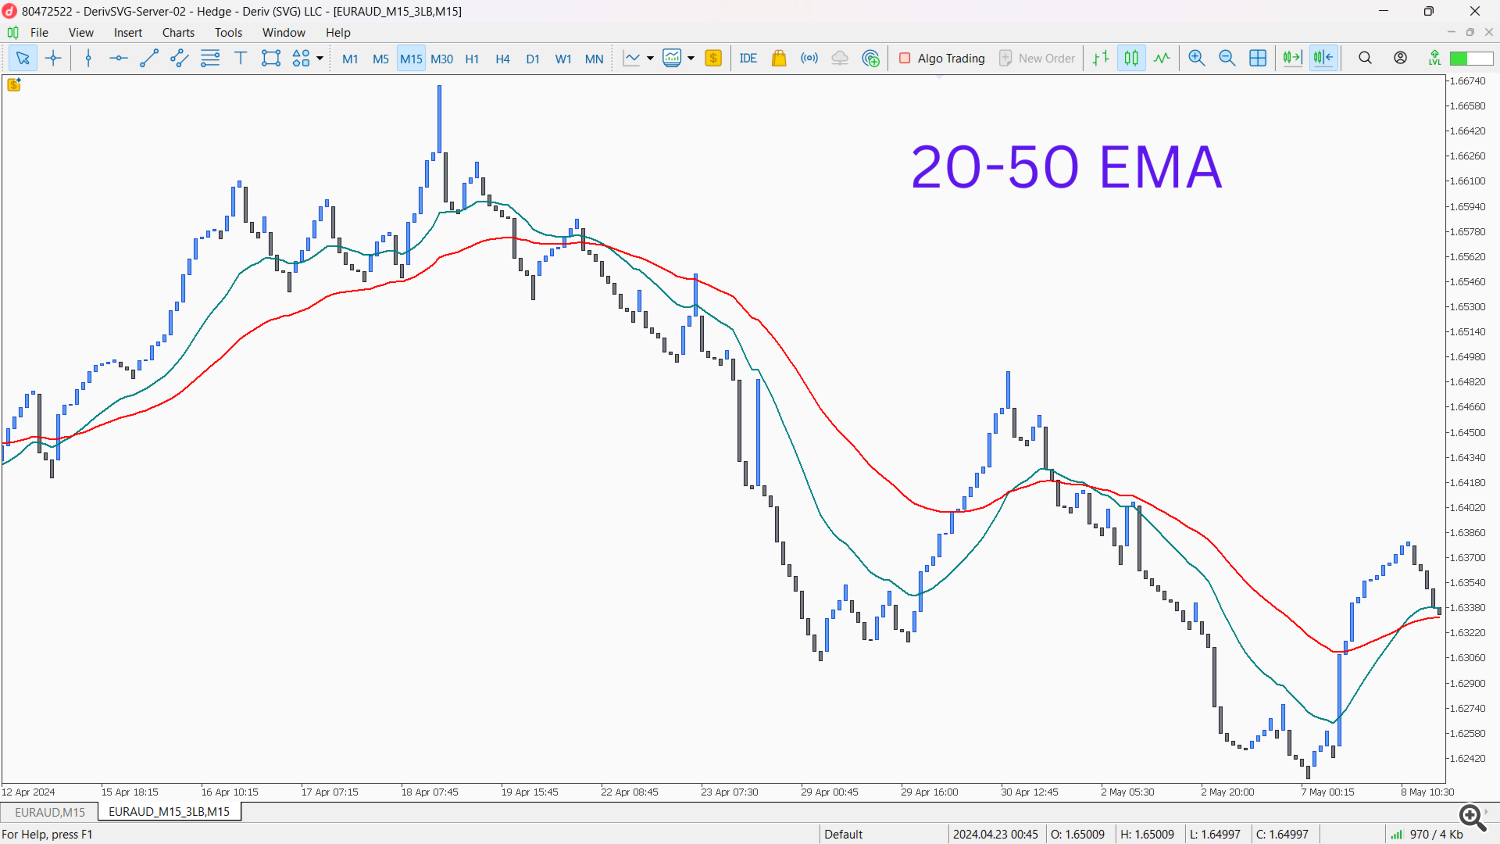
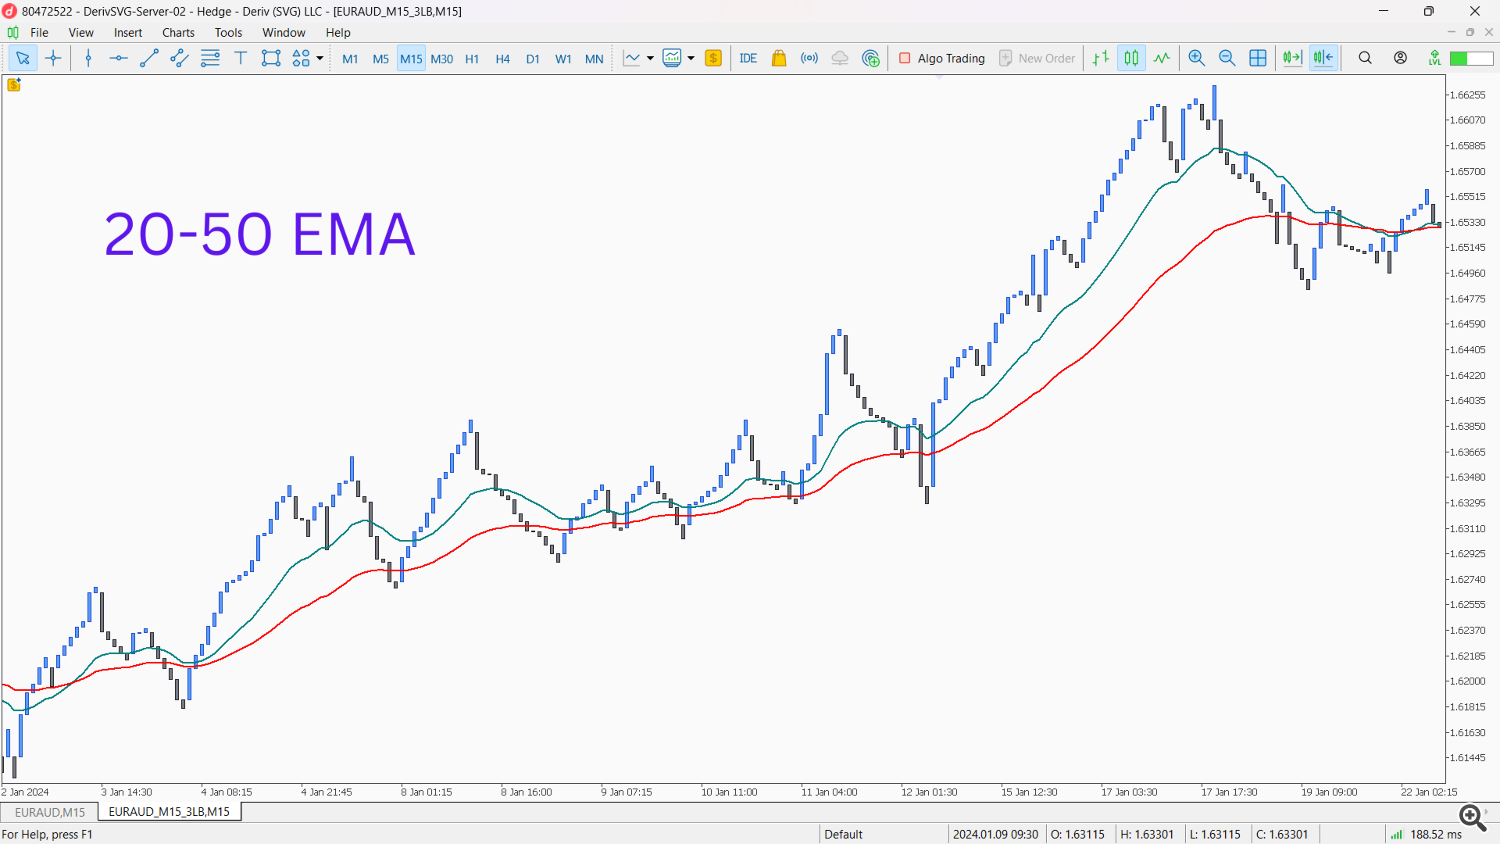
- Setup: Apply two Exponential Moving Averages (EMAs) – e.g., 20-period and 50-period – directly onto your Line Break Chart.
- Entry: For a continuation of an uptrend, wait for the shorter EMA to cross above the longer EMA on the Line Break chart, confirming the current upward Line Break trend. For a downtrend, the shorter EMA crosses below the longer.
- Confirmation: The EMAs should be sloped in the direction of the Line Break trend.
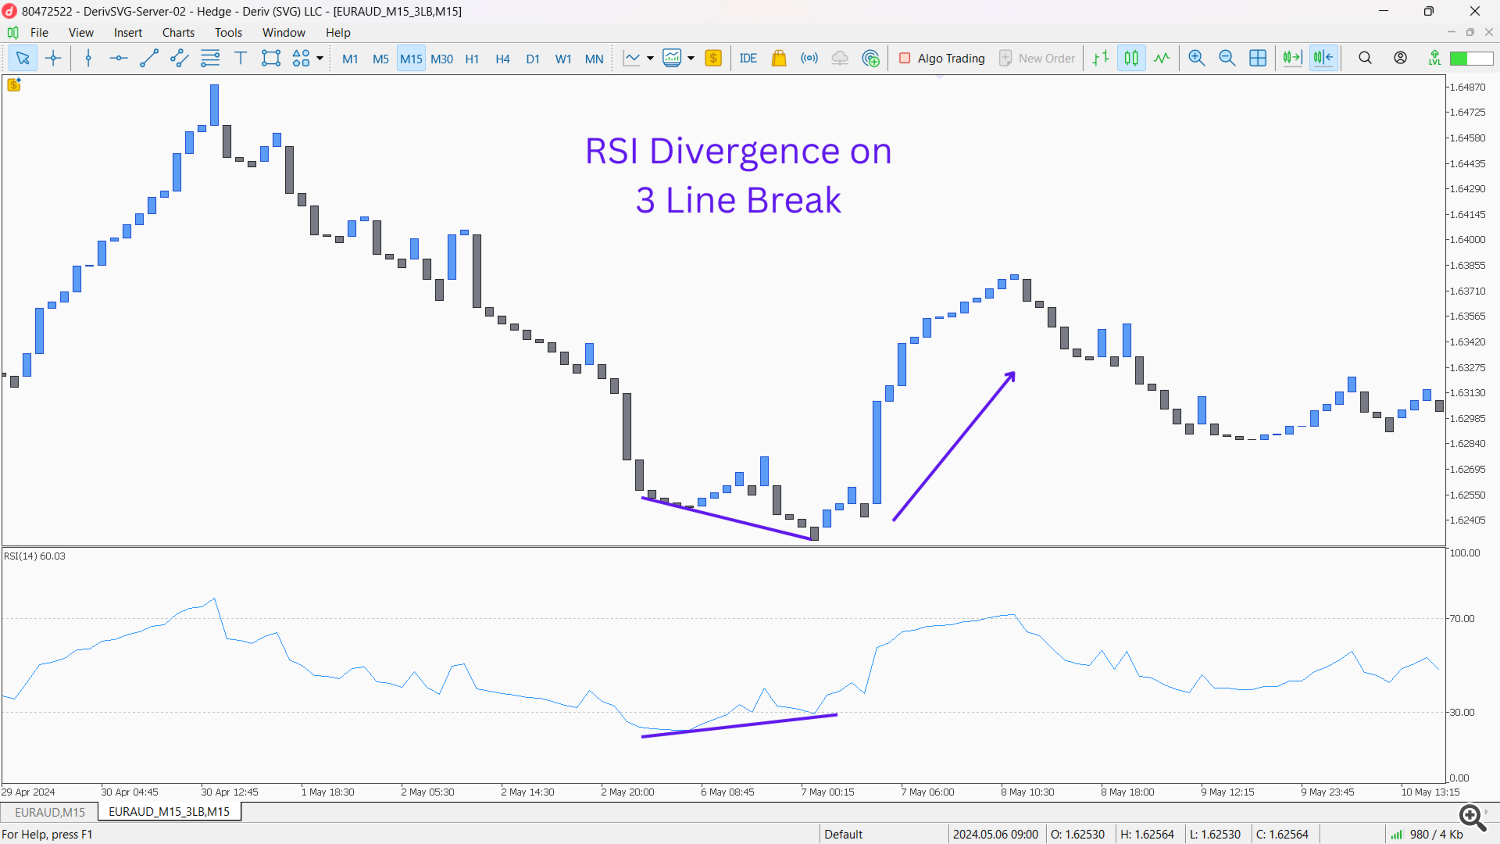
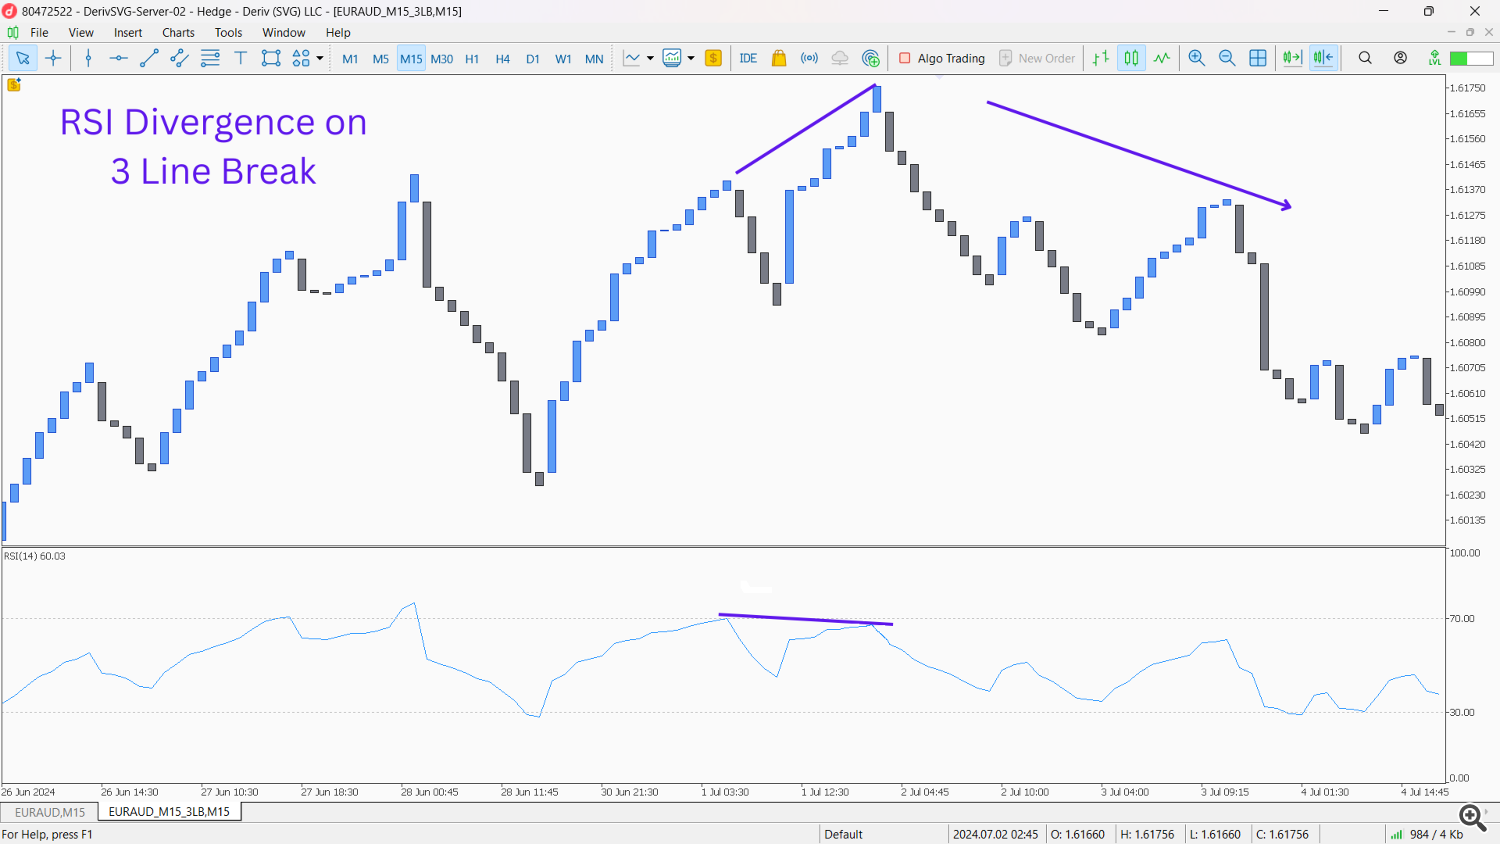
- Line Break & RSI Divergence (on Line Break Chart):
- Setup: Apply the Relative Strength Index (RSI) indicator (e.g., 14-period) to your Line Break Chart.
- Entry: Look for hidden bullish divergence during an uptrend: Price on the Line Break chart makes a higher low, but RSI makes a lower low. This indicates underlying strength and a likely continuation of the uptrend after a pullback. For bearish continuation: Price makes a lower high, RSI makes a higher high.
- Confirmation: The Line Break chart should resume its trend direction after the divergence.
Reversal Strategies:
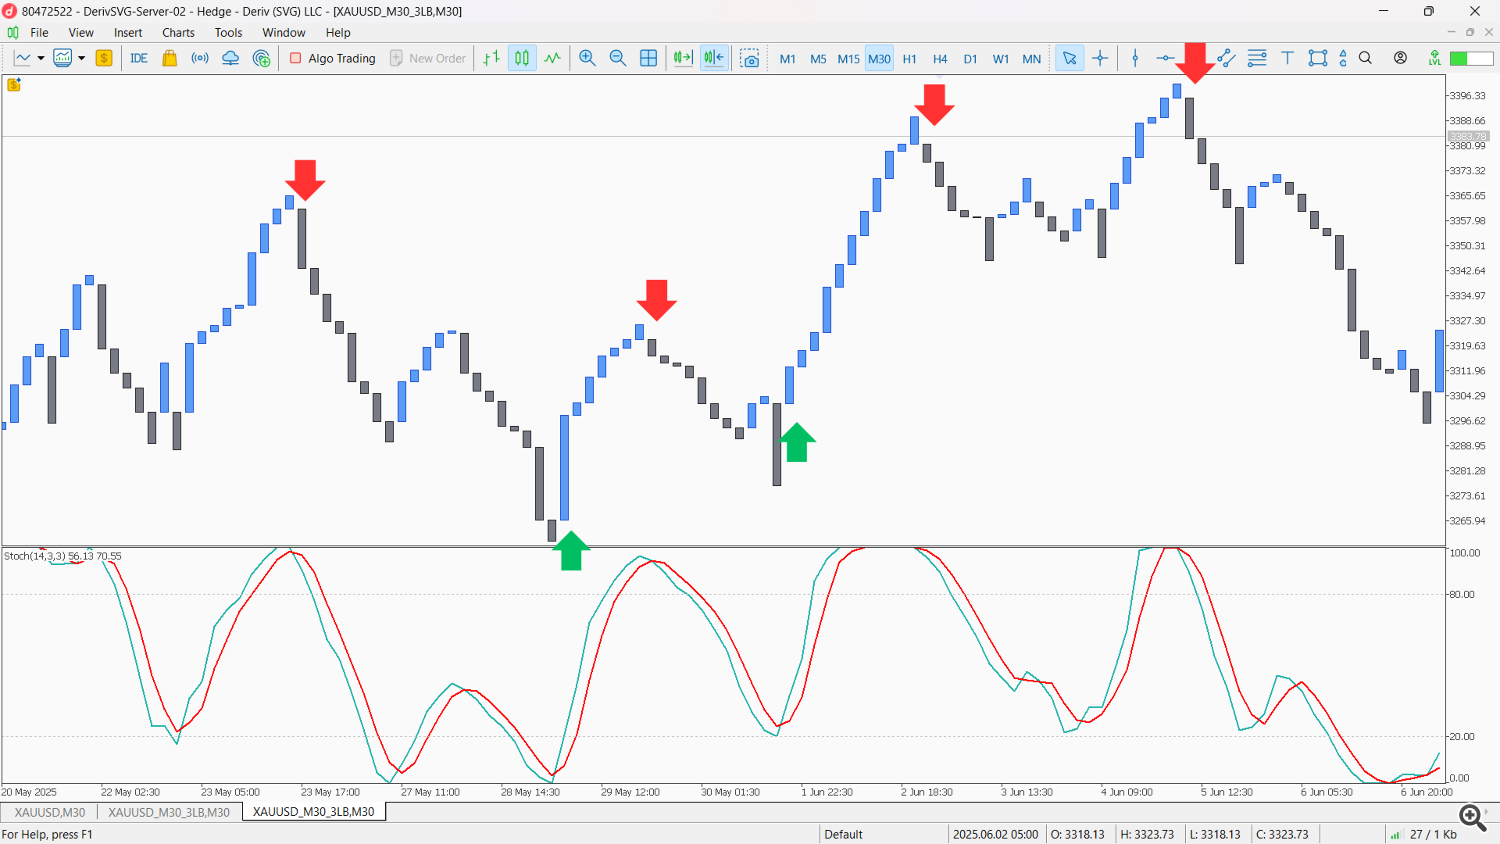
- Line Break & Stochastic Crossover (on Line Break Chart):
- Setup: Apply the Stochastic Oscillator (e.g., 14, 3, 3) to your Line Break Chart.
- Entry: After a prolonged Line Break trend, look for overbought (above 80) or oversold (below 20) conditions on the Stochastic. A cross of the %K line below the %D line from overbought territory (for a bearish reversal) or above from oversold (for a bullish reversal) concurrently with an opposing Line Break candle forming signals a high-probability reversal.
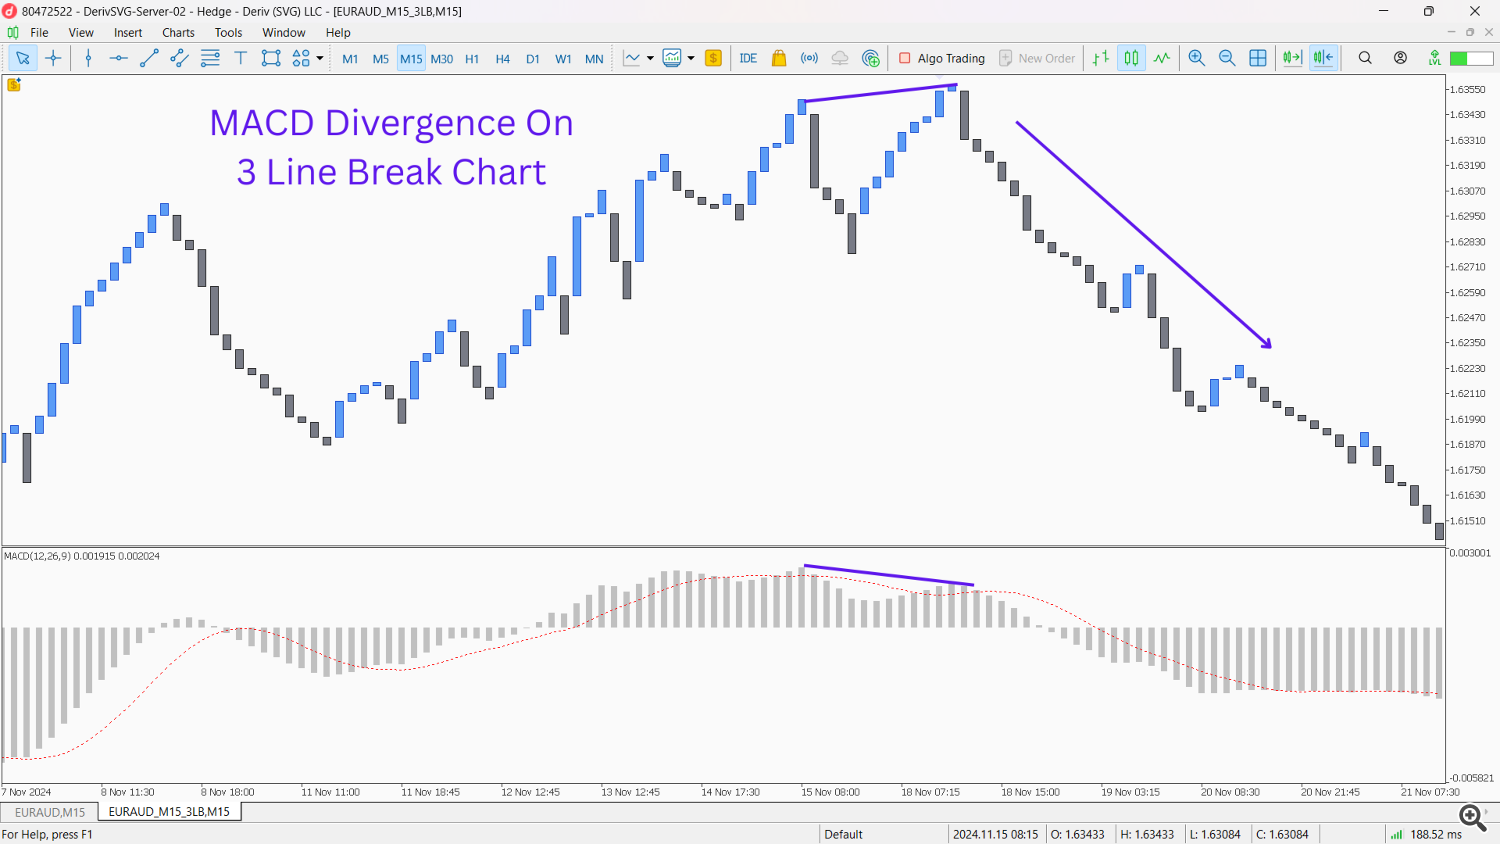
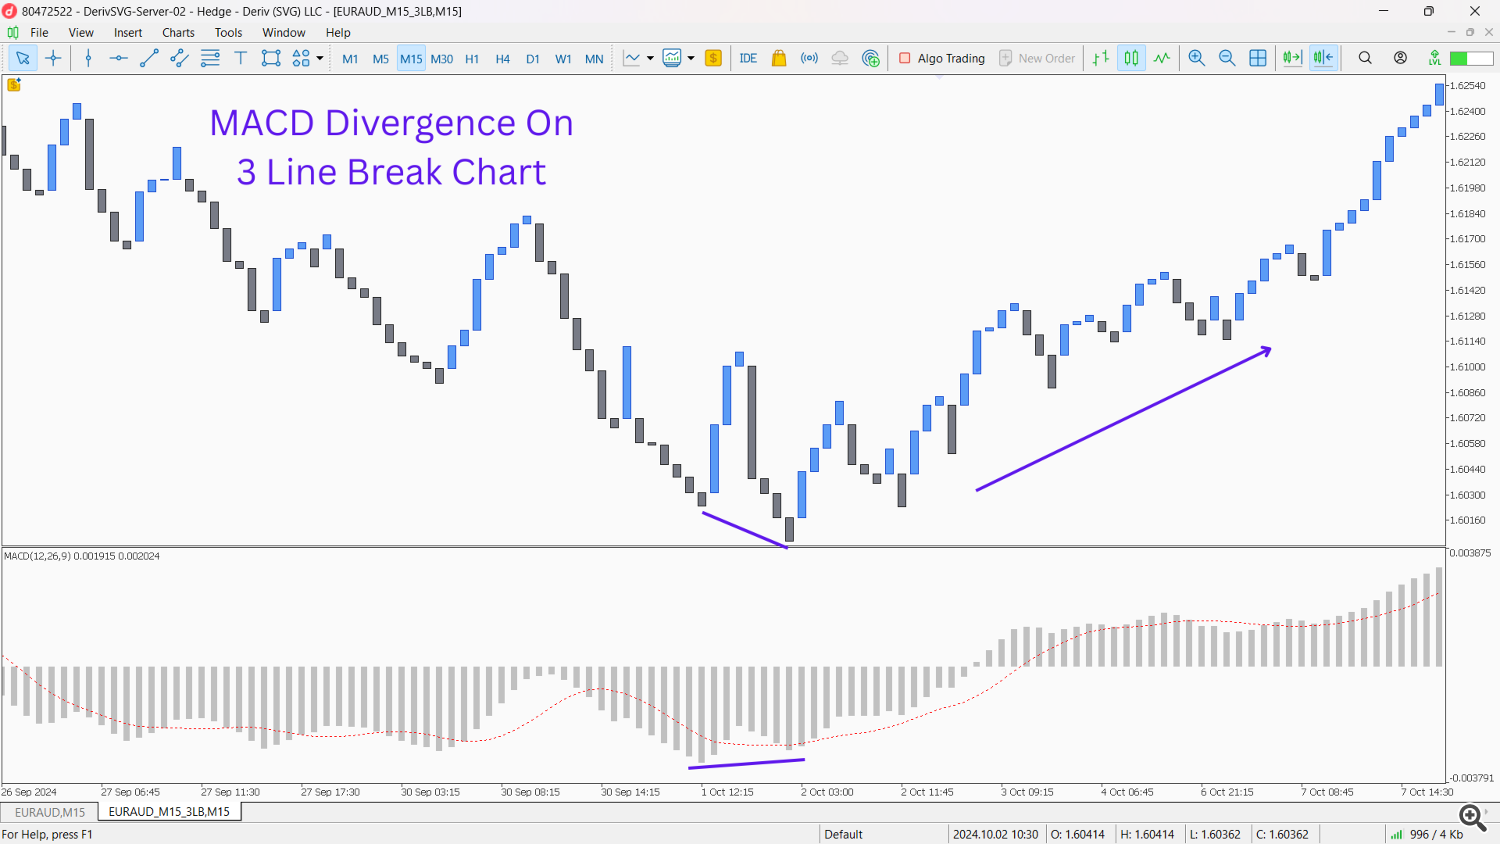
- Setup: Apply the Moving Average Convergence Divergence (MACD) indicator (e.g., 12, 26, 9) to your Line Break Chart.
- Entry: Look for classic bullish divergence: Line Break Chart makes a lower low, but MACD makes a higher low. This indicates weakening bearish momentum and a potential bullish reversal. For bearish divergence: Line Break Chart makes a higher high, but MACD makes a lower high.
- Confirmation: A strong opposing Line Break candle forming after the divergence confirms the reversal.
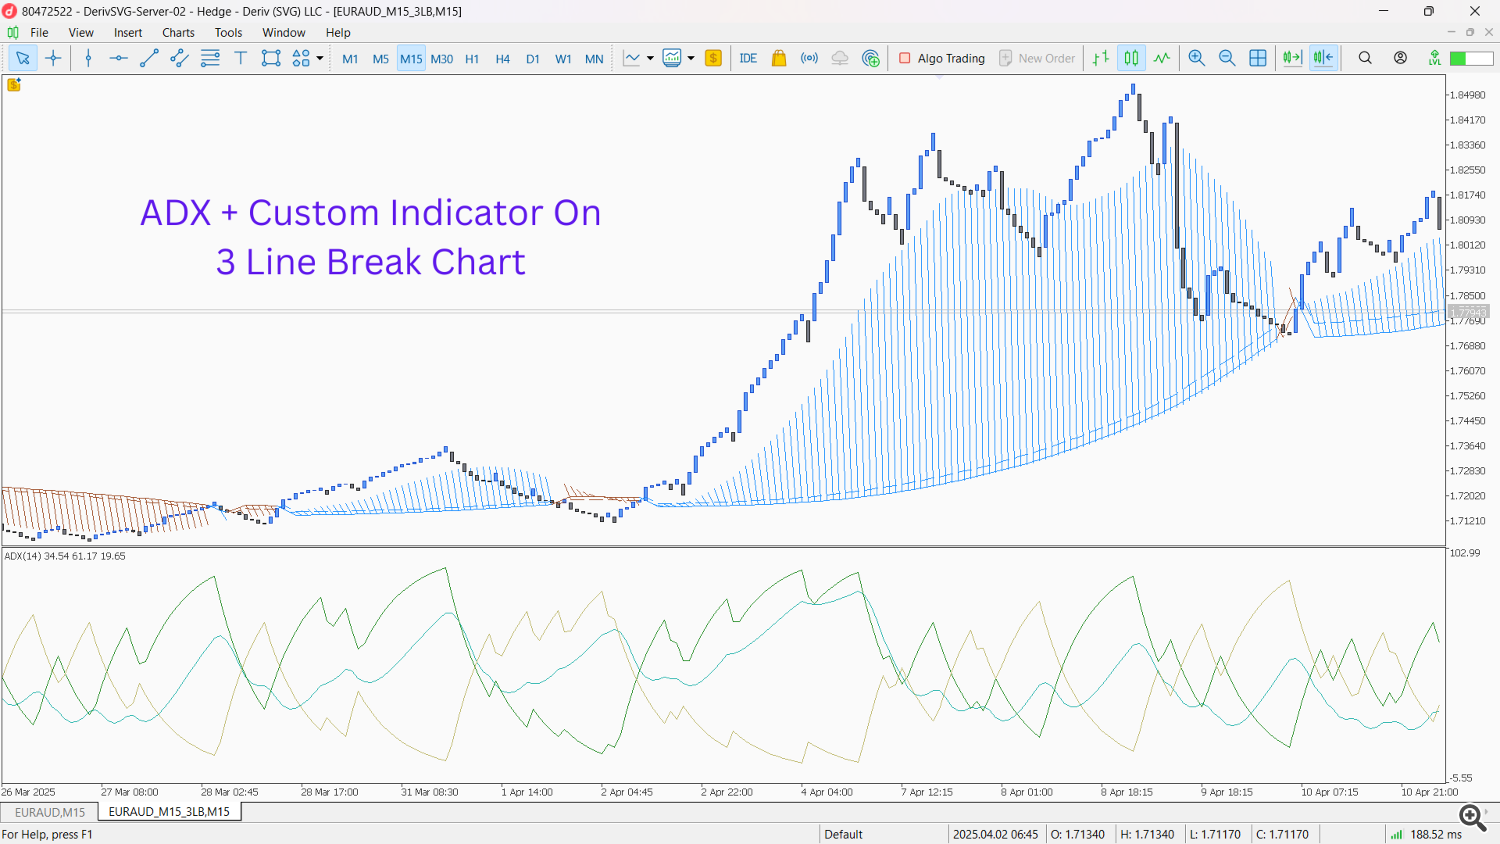
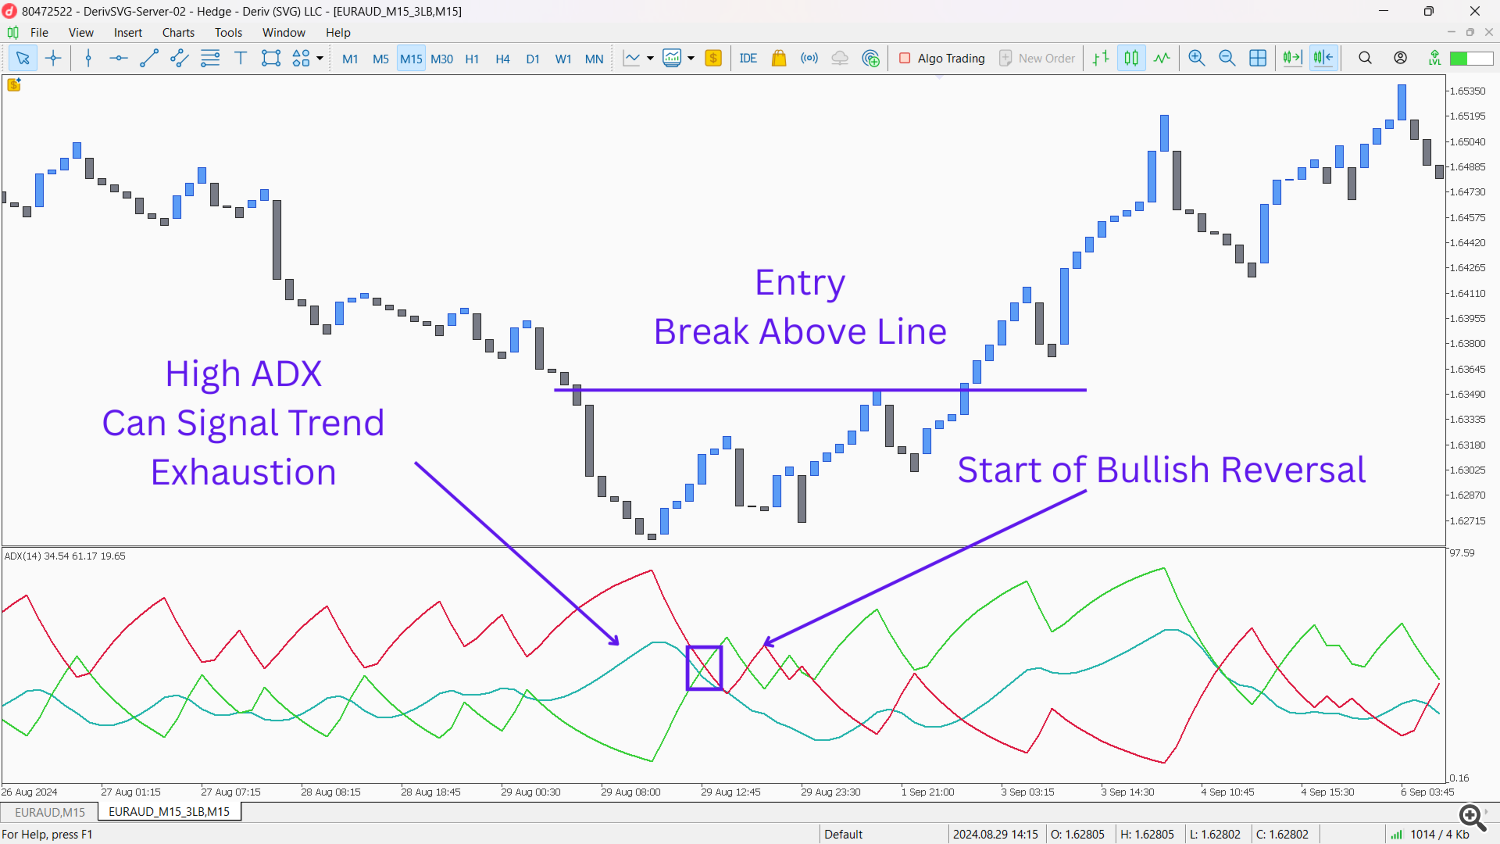
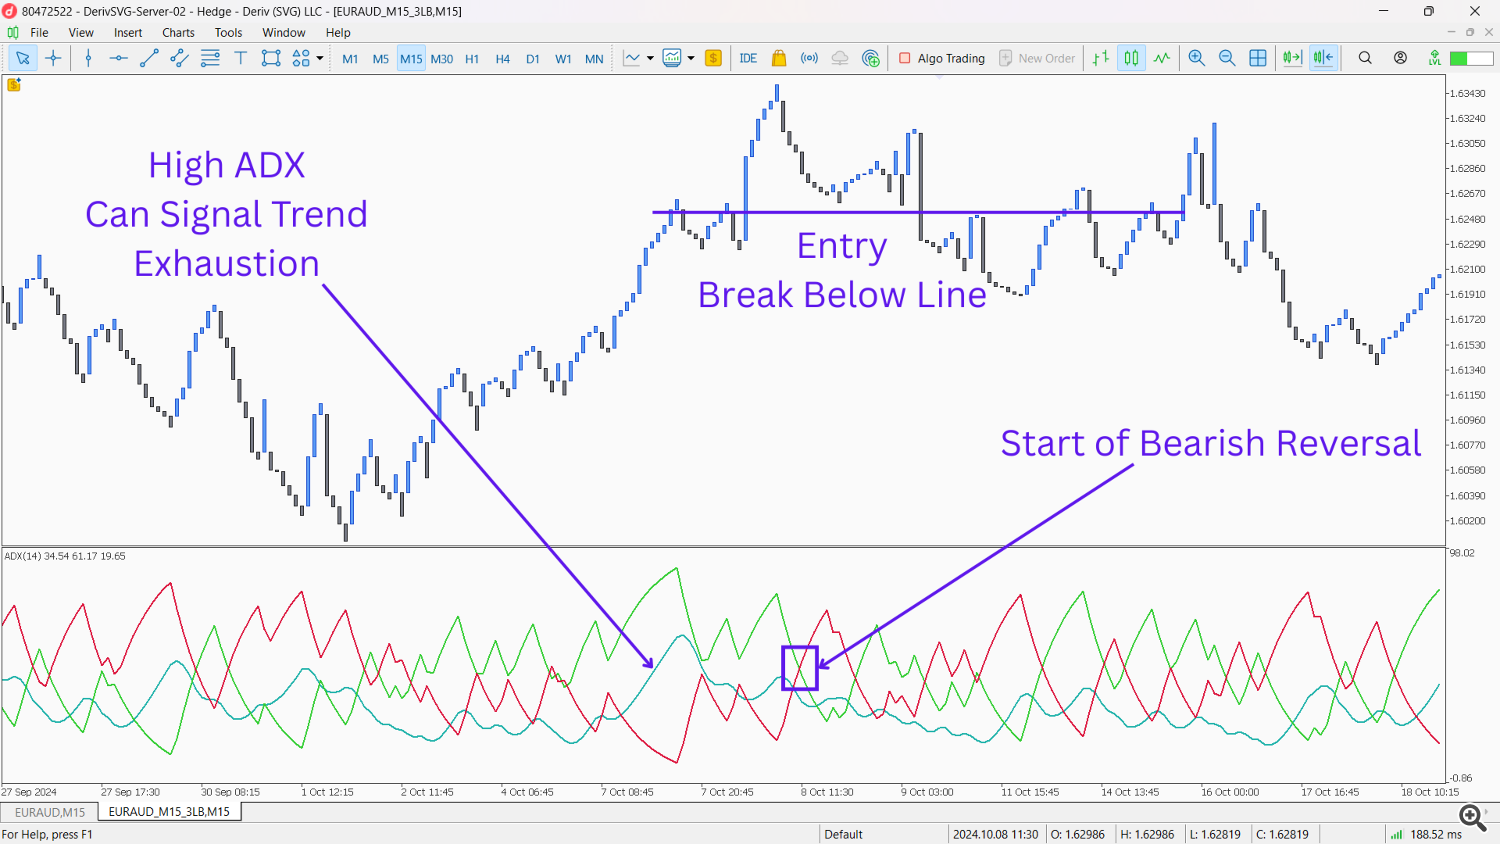
- Setup: Apply the ADX indicator (e.g., 14-period) with its +DI and -DI lines to your Line Break Chart.
- Entry: When the ADX line (representing trend strength) on the Line Break chart is very high (e.g., above 60-70), it suggests the current trend is becoming exhausted. Look for a subsequent opposing Line Break candle to form, especially if the +DI and -DI lines are starting to cross in the direction of the potential reversal.
- Confirmation: A high ADX followed by a clear Line Break reversal often signals a significant turning point.
Conclusion: Embrace the Clarity
Line Break Charts offer a unique and powerful way to view market dynamics, stripping away temporal noise and highlighting true price momentum. While MetaTrader 5’s lack of native support presents an initial hurdle, the use of a dedicated Expert Advisor can unlock the full potential of these charts, allowing traders to overlay their favorite indicators directly onto the filtered price action.
Rule of Thumb: While Line Break Charts excel at clarifying trends and reducing noise, remember that they inherently filter out minor price fluctuations and do not show every single market movement. Therefore, always exercise caution when planning trades and consider combining Line Break analysis with a broader market context or higher timeframe analysis to gain a more complete understanding of volatility and price action.
By understanding the historical context, appreciating the critical difference between actual candles and mere overlays, and exploring both naked and indicator-assisted strategies, traders can significantly enhance their analytical edge. I encourage you, the reader, to download or create an EA for Line Break Charts, experiment with your beloved indicators, and observe how they behave on these refined charts. You might just discover entirely new strategies and insights that transform your trading approach. Good luck, and happy charting!
Trial Vs Pro Version
|
Trial |
Pro |
|
Fixed Historical Data |
Unlimited Historical Data |
|
No Market Book Update |
Market Book Update |
